
Top Prop Firms with the Best Spreads
Prop trading is the practice where traders use the firm’s capital rather than their own to trade in financial markets. This allows traders to keep a portion of the profits without risking their own funds, creating a great opportunity for both beginners and experienced traders. This model reduces personal financial risk, making prop trading a desirable option for traders.
With so many firms competing for new traders, finding the right prop firm isn’t always straightforward. Each company has its own mix of profit splits, trading costs, and platform features.
That’s why it’s important to look closely at what’s on offer, especially when it comes to spreads, which can make a real difference to your bottom line. In this article, we’ll break down why spreads matter and point you to the top prop firms offering the most competitive rates.
Why Spreads Matter When You Choose a Prop Firm for Trading
When selecting a prop firm, it’s essential to consider multiple factors. Reputation, affordable fees, and the availability of essential tools and platforms should be at the top of your list.
Moreover, educational materials and mentorship are key for new traders, as they can significantly improve their trading skills and knowledge. High-profit splits and a variety of trading instruments are also important, as they directly affect your ability to grow your capital and make money.
However, one of the most important aspects that traders tend to forget are the spreads and commissions. To put it simply, spread refers to the difference in prices between the bid (where you can sell) and the ask (where you can buy) of an asset.
The prop firm or broker charges a commission for executing a trade. These two things affect your profitability directly. Generally, low spreads and commissions are hugely beneficial to traders, especially those using expert advisors (EAs), high-frequency trading (HFT), scalping strategies, or even day trading.
Prop firms and brokers get paid through their commission structure, which includes spreads, commissions, and swaps. A swap is the interest charged on positions that are held overnight. While the commission is generally a fixed fee for each lot traded. On the other hand, spreads have a variable range that is dependent on the asset being traded and the market’s liquidity.
Low spreads and commissions are very important, especially for algorithmic trading or scalping strategies, because these strategies rely on executing numerous trades quickly and efficiently with small profit targets and precise entries. A high spread or high commission can eat into profits when a trader continually opens and closes positions.
For example, if you’re trading multiple times per day, even a small spread of 1 or 2 pips can add up to substantial losses over time. This is why tight spreads and low commissions are important, especially for traders who rely on quick price movements.
Top prop firms with the best spreads 2025
In this section, we’ll highlight the best prop firms of 2025, focusing on criteria such as competitive spreads, low commissions, and other essential features that set them apart.
1. Top One Trader
Top One Trader is a prop trading firm known for its exceptional trading conditions. This firm offers traders the opportunity to develop their skills and capital while enjoying some of the best features in the industry.
– Tight Spreads and Advanced Trading Platforms.
Top One Trader offers tight raw spreads, especially when the market is highly liquid. Their spreads usually range from 0 to 2 pips, and commissions are between $0 and $2.50 per lot. These values can change depending on the asset or platform, but overall, they are on the lower side compared to many competitors in the industry.
Top One Trader’s low commissions and tight spreads are ideal for traders who engage in expert advisors (EA), scalping, or news trading, where small price movements can significantly impact profits.
They also provide access to advanced platforms like TradeLocker, which integrates seamlessly with TradingView. This integration offers traders powerful tools to analyze markets and execute trades.
– Quick Payouts and Generous Profit Splits
Top One Trader also distinguishes itself with its prompt payouts, ensuring that traders can access their profits within less than two hours. This provides more freedom and faster access to funds, especially when many prop firms can take days or even weeks to handle withdrawals.
Aside from its quick payouts, they offer significant profit splits, allowing them to keep up to 90% of the profits generated from trading. Given that most companies offer splits between 70% and 80%, this high percentage is well above the industry average.
– Scalable Opportunities and Comprehensive Educational Resources
Top One Trader also provides a scaling plan for traders. As they gain expertise and improve their trading techniques and profitability, they can scale their accounts from $200,000 to $5 million, offering plenty of room for development. For traders wishing to maximize their profits over time, this scalability can be a great deal.
They provide extensive educational resources for individuals just starting out, including mentoring, video coaching programs, and weekly coaching sessions led by business leaders. This ensures that beginner traders have all the resources they need to start trading the right way and develop their skills, while skilled traders can benefit from advanced strategies and market analysis.
– Transparent Evaluation Process and Flexibility in Trading Styles
With clear trading rules and several program options like the 1-Step Challenge, 2-Step Challenge, and express funded accounts, Top One Trader is both open and equitable, making it easier for traders to reach their profit targets more quickly and efficiently.
Top One Trader is also known for its adaptability in trading techniques, allows traders to use any of the trading styles they prefer, use Expert Advisors (EAs), hold positions overnight, or trade over weekends, and have no time limit on passing challenges; making it a perfect fit for all types of traders who want to improve their stratégies.
Stay ahead of the market with Top One Trader’s Economic Calendar. Track key economic events and news releases to make informed trading decisions. Stay prepared and trade with confidence today!
2. DNA Funded
DNA Funded is an excellent choice for forex traders seeking low spreads and commission . It offers forex spreads starting from 0.0 pips on major pairs like EUR/USD and up to 0.2 pips on other pairs, allowing traders to fully capitalize on market movements without high trading costs cutting into their profits.
The commission structure is straightforward, with traders paying a $5 commission per lot on forex pairs. This is notably lower than many other prop firms, making it ideal for algorithms strategies or scalping strategies where every pip and fee matters.
With competitive spreads and low commissions, DNA Funded also provides progressive trading platform with over 800 tradable markets, making it a good option for those seeking to diversify their portfolios across forex, commodities, indices, and more.

3. BrightFunded
For traders who wish to maximize profits while under flexible trading conditions, BrightFunded presents a good mix of low costs and competitive profit splits. Profit splits range from 80% to 100%, depending on performance and the selected program, which is among the highest in the business, allowing traders to keep a large portion of their gains. Like Top One Trader, BrightFunded imposes no time limits on its challenges, giving traders the flexibility to apply their trading styles and meet profit targets without feeling rushed.
BrightFunded also provides low spreads averaging 0.1 pips with commission-free trading on all assets—including forex, commodities, and cryptocurrencies. Additionally, the firm’s Trade2Earn loyalty program offers scalable opportunities, allowing advanced traders to grow their accounts.

4. Think Capital
ThinkCapital is another leading proprietary trading firm that combines low spreads, flexible leverage, and low commissions to provide an attractive trading environment for both new and experienced traders.
On Think Capital, traders can get low commissions during trading, with raw spreads applied to all assets. For those who prefer MT5, Think Capital offers raw spreads with a commission of $4 per lot for forex and commodities, which is highly competitive in the industry.
ThinkCapital offers high profit splits for traders who consistently generate profits. With up to 90% profit splits, it provides significant incentives for traders to improve their performance. The firm also supports different trading styles allowing scalping, news trading, and the use of EAs, making it highly flexible for traders with various styles. With leverage options that range from 1:30 to 1:100 depending on the asset, traders have the flexibility to apply their strategies and risk management plans while maximizing their potential returns.

5. IC Funded
IC Funded, powered by the reputable forex broker IC Markets, is a strong competitor in the trading industry, offering low spreads and low commissions and real time market data.
IC Funded offers extremely tight spreads, averaging 0.02 pips on major forex pairs. This, combined with a commission fee of $3.50 per lot, ensures that traders can keep their costs low, especially when executing a lot of trades.
Also, IC Funded’s high leverage options (up to 1:500) and flexible trading conditions make it ideal for prop traders who want to scale their trading strategies quickly. The firm also supports MT4, MT5, and cTrader, providing traders with multiple platform options to suit their needs.

6. City Traders Imperium
City Traders Imperium (CTI) offers funded accounts to traders, providing access to various instruments like forex, commodities, indices, and cryptocurrencies. Trading platforms CTI supports include MetaTrader 5 (MT5) and Match Trader, offering advanced charting tools and flexible conditions like no minimum trading days requirement and no restrictions during high impact news events, which make it easier to reach profit targets and become funded.
These platforms are available on desktop, web, and mobile, allowing traders to manage their accounts from anywhere.
CTI’s commission structure is competitive: $5 per lot per side for forex and commodities, and $0.50 per lot per side for indices. Cryptocurrencies have no commission. Spreads are variable and depend on market conditions, the average spread is approximately 0.3 pips.
Conclusion
In conclusion, choosing the right prop trading firm is essential for success in the competitive world of financial markets. The firms highlighted in this article—Top One Trader, DNA Funded, BrightFunded, Think Capital, and IC Funded—offer traders a range of attractive features, including low spreads, competitive commissions, good trading platforms and flexible trading conditions. These elements let traders focused on their trading strategies and maximize their profits while minimizing their costs, especially when using strategies like using expert advisors (EA) , scalping, or day trading.
However, to succeed in prop trading, traders must also focus on developing a well-defined strategy, a robust risk management plan, and learn about trading psychology. While a good prop firm provides the necessary tools, platforms, and support, a trader’s ability to execute their strategy efficiently is just as important. By partnering with a reputable prop trading firm, like those discussed here, traders can access the resources needed to grow their skills, scale their capital, and ultimately achieve their goals.
Take your trading to the next level with Top One Trader. The platform supports various strategies, provides low spreads and commissions, and offers educational resources to help you build and refine your own strategy. Start trading today and gain access to the tools and support needed for success!
Are Prop Firms A Scam?
The trading landscape has changed dramatically with the rise of proprietary (prop) trading firms. Unlike traditional brokers, prop firms allow traders to access company capital rather than risking their own funds. In return, traders share a portion of their profits while avoiding the typical commissions or spreads associated with personal trading accounts.
This model has opened new doors for aspiring and experienced traders alike, but it’s also raised important questions. Are prop firms a genuine opportunity, or just another scam?
In this article, we’ll break down how prop trading firms operate, how they differ from traditional brokers, and what their evaluation processes typically involve. We’ll also show you how to spot legitimate firms and the warning signs of scams, so you can make informed choices before getting started.
What Are Prop Firms?
At its core, a proprietary trading firm (or prop firm) is a company that funds traders, allowing them to trade in financial markets using the firm’s capital. In return, traders share a percentage of their profits with the firm. This model is especially attractive to skilled individuals who may lack the personal funds to trade at scale but have the experience and discipline to succeed in the markets.
Prop firms typically give traders access to a wide range of financial instruments, including forex, commodities, indices, stocks, and cryptocurrencies. This allows traders to diversify and choose markets that suit their strategies.
Beyond capital, prop firms provide a comprehensive trading infrastructure. Traders are given access to a professional trading platform equipped with all the tools necessary for decision-making. These include:
- Technical analysis tools (like charting indicators, drawing tools, and indicators)
- Order types (such as market, limit, and stop orders).
- Risk management tools (such as position sizing calculator and stop-loss orders).
- Performance dashboards to track metrics like profit/loss, win rate, and drawdown.
- Economic calendars to stay informed about major financial news and data releases that might impact the markets.

How Prop Firms Work?
Typically, traders can expect to keep anywhere from 70% to 90% of the profits, with the firm retaining the remaining portion.
However, before this, traders must pass a challenge and an evaluation process to demonstrate that they can effectively manage the firm’s money, generate consistent profits, and manage risks appropriately.
The Evaluation Process
Since prop firms are entrusting significant capital to traders, they need to ensure that the individuals they fund are skilled and capable of managing the risks involved and making profits. This is where the prop firm challenge comes into play.
The prop firm challenge is essentially a test where traders need to meet specific performance criteria, such as achieving a certain profit target while adhering to risk management guidelines, before being awarded live capital.
There are various evaluation phases, which can range from a one-step to a more complex three-step process. Some firms even offer instant funding accounts, where traders can bypass the evaluation process and gain immediate access to the firm’s capital. However, these types of accounts come with strict rules in terms of drawdowns.
Becoming a funded trader is an exciting opportunity, but having the right skills is key! Top One Trader equips you with the essential tools and real trading capital in a supportive environment, allowing you to seize opportunities without putting your own money on the line.
Are Prop Firms Legitimate or Just a Scam?
It’s a fair question, and one we hear often. The truth is that prop trading is a legitimate and well-established model used by reputable firms worldwide. When structured properly, it offers a win-win setup: traders get access to capital and a performance-based profit split, while the firm benefits from their trading success.
But like any industry, not all players are equal. While many firms operate transparently and provide real value, there are also bad actors. Some so-called “prop firms” lure in beginners with promises of quick profits, only to impose hidden fees, overly restrictive rules, or unrealistic evaluation challenges that make success nearly impossible.
That’s why it’s important to understand how legitimate prop firms work, what fair terms look like, and what red flags to watch out for. A genuine prop firm is invested in your long-term success, not just in collecting challenge fees. Now, let’s tackle the central question: Are prop firms legitimate or just a scam?
The short answer is that prop firms aren’t necessarily scams. There are many reputable and well-established firms that operate transparently and provide a valuable service to both traders and investors. These firms offer traders the opportunity to grow their careers, access funding, and split profits based on their performance. When done right, prop trading is a mutually beneficial arrangement where both the trader and the firm can succeed.
Key Red Flags to Identify Prop Trading Scams
To avoid falling for a scam, be on the lookout for these red flags:
- Fake or Inconsistent Reviews: A sudden surge of overly positive reviews, especially posted within a short time frame, can signal manipulation.
- Unprofessional Website: Legitimate firms invest in a professional, well-organized website. Poor design, missing information, or spelling errors are strong indicators of a scam.
- Unrealistic Evaluation Challenges: Be cautious of firms that impose extreme profit targets, harsh time limits, or hidden rules. Legitimate prop firms set reasonable, transparent goals focused on consistency and risk management.
- Excessive Fees: High spreads, commissions, or hidden charges can quietly erode your profits. Compare fee structures with industry norms to ensure fairness.
- Get-Rich-Quick Promises: Any firm advertising effortless profits or “easy funding” at suspiciously low prices should be treated with skepticism. Real trading requires skill, patience, and discipline.
How to Spot Reputable Prop Firms

If you’re thinking about getting into prop trading, you want to make sure you’re partnering with a legitimate firm. With so many options out there, it’s easy to get lost or even fall into the trap of a scam. So, how can you spot the real deal? Here are some practical tips.
Look for a Solid Online Presence and Positive Reviews
First things first: check how the firm presents itself online. Reputable firms usually have a professional, active online presence. This means not just a sleek website but also activity across social media, review sites, and trading forums. You should see consistent, genuine feedback from actual traders, not just praise from the firm itself.
Platforms like TrustPilot and Reddit are great places to see what people really think. A solid track record of positive reviews is a good indicator. But here’s a trick: pay attention to the consistency of reviews. If a firm has mostly glowing reviews all posted at once, that could be a red flag. Scammers love to post fake reviews to make themselves look trustworthy.
Check the prop firm’s website for professionalism and transparency
Next up: the website. This may seem simple, but it’s surprisingly telling. A well-organized website is one of the easiest ways to assess a firm’s legitimacy. Legitimate prop firms will have clear, easy-to-understand information about their evaluation process, funding models, and profit sharing.
If the website feels sketchy, lacks important details, or is full of spelling mistakes, it’s time to move on. Trustworthy firms don’t just throw up a website; they invest in it. A well-designed site with all the information you need shows they’re committed to transparency.
Many prop firms also provide extra resources on their website, such as an economic calendar, a position size calculator, and educational resources. This is a green flag that shows the firm is dedicated to supporting traders and working on improving itself, proving its legitimacy.
Look for clear and reasonable evaluation requirements
Legit prop firms set clear and reasonable evaluation criteria, with structured goals like profit targets and risk management rules to assess your ability to handle their capital. However, if a firm sets unrealistic goals, such as massive profits with minimal risk or impossible time constraints, it could be a scam.
A legitimate firm focuses on consistency and skill, not on impossible tasks. Legit prop firms must have clear rules, while scam firms often hide the rules, setting up challenges that are designed for traders to fail.
Check Their Customer Support Responsiveness
If you’re serious about joining a prop firm, don’t skip testing their customer service. Reach out with a couple of questions, even before you sign up. How quickly do they respond? Are they helpful and clear in their answers? Do they understand the business?
A good prop firm will have a responsive, friendly customer support team to help you with anything you need. If they don’t respond, or if their answers feel vague or unprofessional, it’s a huge red flag. Good firms care about your success, and that starts with being responsive to your questions.
Can You Earn Money with Prop Firms?

Yes, you can earn money with prop firms, but it’s not as simple as just signing up. Success requires more than just access to capital; it demands skill, strategy, and discipline.
Why the Evaluation Process Is Tough
The evaluation process is challenging because prop firms want to fund only the best traders. It’s your chance to prove you can meet their requirements, like hitting profit goals and managing risk effectively. Prop firms seek traders who consistently manage risks and avoid gambling on one trade. This process isn’t meant to trick you, but ensures firms are backing skilled traders. Use it as an opportunity to improve your skills.
The Profit Split Model and Realistic Expectations
Once you pass the evaluation, you’ll typically share profits with the firm, ranging from 70% to 100%, depending on performance. If you achieve consistent profits, the firm may increase your profit split and offer a scaling opportunity.
However, be realistic and set reasonable targets. Success isn’t about getting rich quickly. Instead, focus on building a consistent strategy for the long term.
Developing a Consistent Strategy
Success in prop trading requires a consistent strategy, discipline, and strong risk management. A successful trader follows a well-defined plan and focuses on long-term profitability, not quick wins. Consistency is key—over time, you’ll refine your strategy and improve your trading skills.

Conclusion
Proprietary firms are not inherently scams. Many reputable prop firms offer real opportunities, funding skilled traders, and supporting them with structured evaluation systems and professional tools.
However, success in this industry demands caution and preparation. Always research a firm thoroughly, watch for red flags, and avoid being tempted by unrealistic promises. A legitimate prop firm will be transparent, offer clear evaluation criteria, and be invested in your long-term growth, not in quick profits at your expense.
If you’re ready to take your trading career seriously, find a firm that values skill, discipline, and consistency over luck. With the right partner, you can access real funding, sharpen your strategy, and build lasting success.
At Top One Trader, we offer traders a transparent path to funded accounts, realistic evaluation processes, and the resources needed to grow their skills. Start your journey today with a firm that’s committed to helping you succeed.
Mastering Day Trading Patterns: A Practical Guide
Day trading is a fast-paced game of timing, precision, and quick decision-making. It’s not just about buying and selling, it’s about interpreting the market as a story unfolding in real time.
There are many trading strategies, along with numerous tools that can easily confuse traders, especially beginners. One of the most common and effective strategies is the use of chart patterns. These patterns have consistently proven their effectiveness across different markets, time frames, and periods.
Trading Chart patterns have been used in trading for over a century. Their use as a technical analysis tool dates back to the early 20th century, particularly through the work of Charles Dow, the founder of Dow Theory.
In this article, we’re going to discuss chart patterns, whether they’re reliable, especially for day trading, and how to use them properly.
What Are Trading Patterns?
Chart patterns are visual formations on price charts that reflect market psychology, indicating how buyers and sellers are behaving and where momentum may be headed. In technical analysis, patterns help predict future price movements, signaling reversals, continuations, or consolidation periods.
Trading patterns work alongside price action, allowing traders to gauge market sentiment – whether bulls or bears are in control and if the trend will continue or reverse.
Recognizing these patterns early enables traders to react with clarity and precision, providing precise entries, clear targets, and a higher win rate with a positive reward-to-risk ratio. This improves consistency and helps traders grow their skills and capital over time.
Different Types of Patterns
In this section, we will break down chart patterns into three main categories: Reversal Patterns, Continuation Patterns, and Candlestick Patterns.
Reversal Patterns
Reversal patterns are powerful signals that the market might be preparing for trend reversals. They are especially useful for identifying the end of a trend and the beginning of a new one, something every day trader should watch closely.
Head and Shoulders /Inverse Head and Shoulders
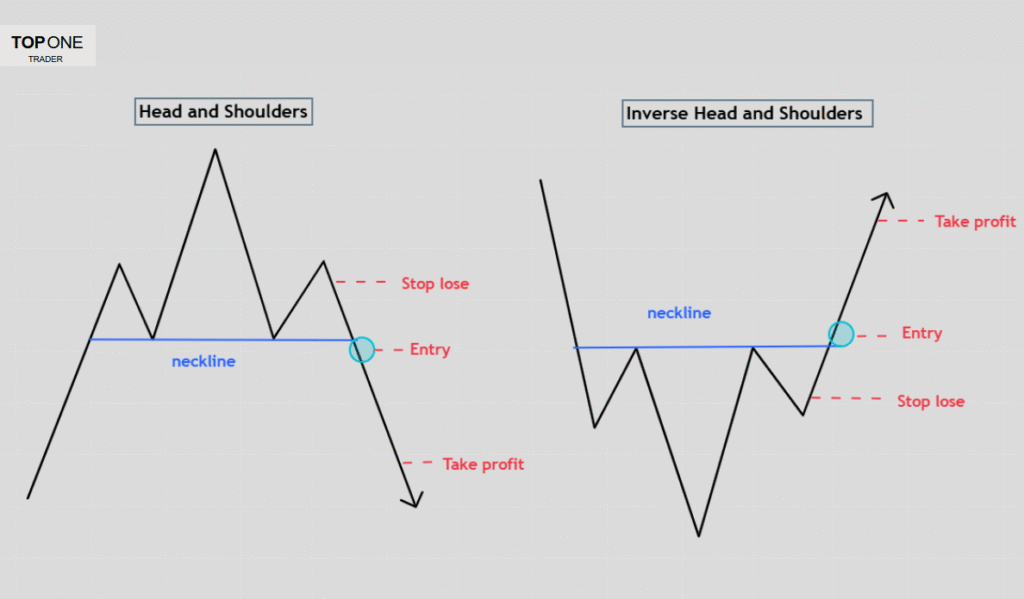
The Head and Shoulders pattern signals a potential bearish reversal after an uptrend. It forms when price makes a higher high (head) but then fails to break it again (right shoulder), showing that buyers are losing momentum.
A break below the neckline confirms the shift to bearish. The Inverse Head and Shoulders is the opposite—it appears after a downtrend and signals a bullish reversal. It shows sellers losing control as price fails to make a new low and begins forming higher lows. A breakout above the neckline confirms buyer strength and trend reversal.
Double Top and Double Bottom
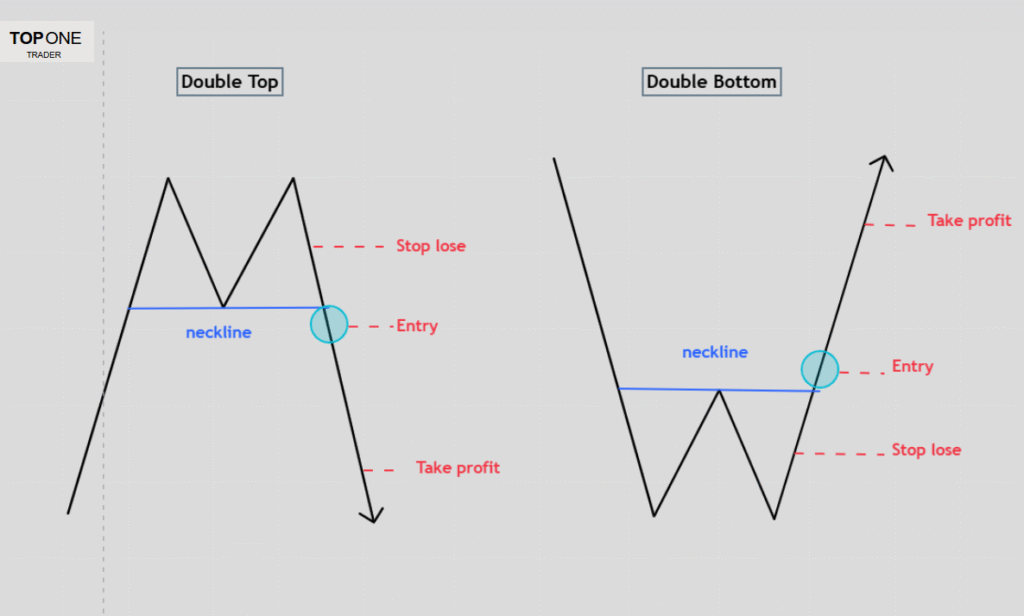
A Double Top pattern typically forms at the end of an uptrend and signals a potential bearish reversal. It occurs when the price reaches a high, pulls back, then makes another attempt to break that high, but fails. This failure to create a new high indicates that buyers are losing momentum and sellers are stepping in, preparing to push the market lower. The pattern is confirmed when the price breaks below the support level (the neckline) between the two peaks.
On the other hand, a Double Bottom forms after a downtrend and signals a potential bullish reversal. It happens when the price hits a low, bounces up, and then retests the same level without breaking it. This shows that sellers are weakening and buying pressure is returning. A break above the neckline confirms that buyers are likely to take control and drive the price higher.
Falling Wedge and Rising Wedge (reversal models)
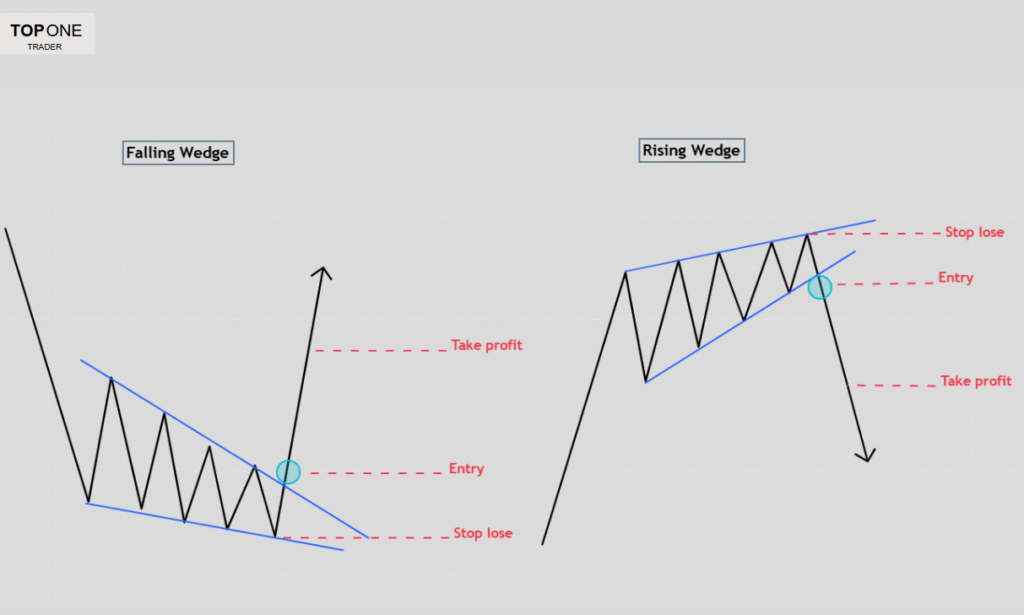
The Falling Wedge and Rising Wedge patterns can act as both reversal and continuation patterns, depending on the trend they form in. As reversal patterns, they appear at the end of a trend. During the consolidation phase in these patterns, the price range tightens, with small candles and low volume signaling a pause in the trend.
A Falling Wedge in a downtrend suggests a bullish reversal, as weakening selling pressure is indicated by the narrowing range, and a breakout above the upper trendline confirms the reversal.
On the other hand, a Rising Wedge in an uptrend signals a potential bearish reversal, as a loss of buying momentum is shown by the narrowing range, with a break below the lower trendline confirming the downward reversal.
Continuation Patterns
When the market is trending, it doesn’t move in a straight line. There are times when price pauses, consolidates, and then continues in the same direction. That’s where continuation patterns come into play, presenting opportunities to enter the market.
Falling Wedge and Rising Wedge (continuation models)
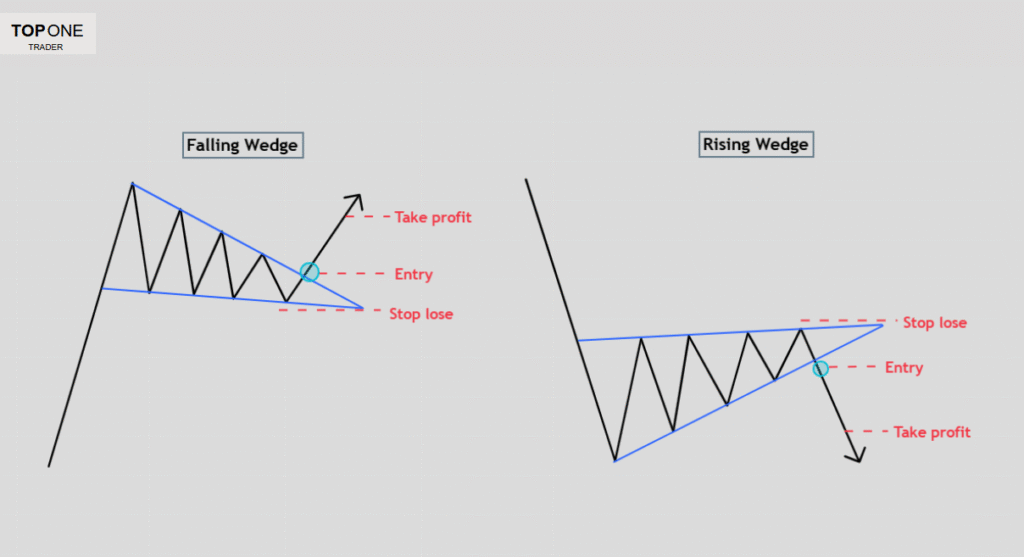
The Falling Wedge and Rising Wedge can also serve as continuation patterns. For example, a falling wedge during an uptrend often signals that the trend will continue higher after a short pullback. Similarly, a rising wedge during a downtrend can indicate the market is preparing to drop further.
Bullish and Bearish Rectangles
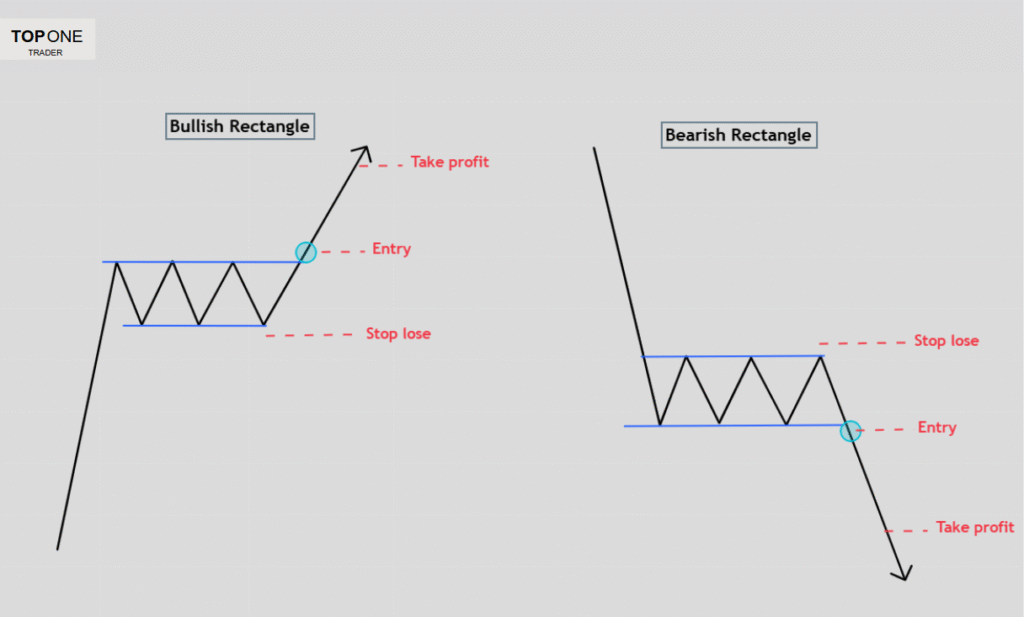
Another useful set of patterns includes Bullish and Bearish Rectangles. These show periods of consolidation – price moving sideways within a range. A bullish rectangle appears in an uptrend, and a breakout above the range confirms trend continuation. A bearish rectangle works the same way in a downtrend.
It’s worth mentioning that there are other continuation patterns, such as flags, symmetrical triangles and pennants. While their shapes differ slightly from wedges and rectangles, they function in similar ways.
These patterns indicate a pause in the market before price continues in its previous direction, making them ideal for entering mid-trend with a tighter stop-loss and a favorable reward-to-risk ratio.
Candlestick Patterns
While trading patterns provide the big picture, candlestick patterns provide a closer look at short-term price action, showing the battle between buyers and sellers through the opening and closing prices. They work best when combined with other technical analysis tools for confirmations, especially during breakouts.
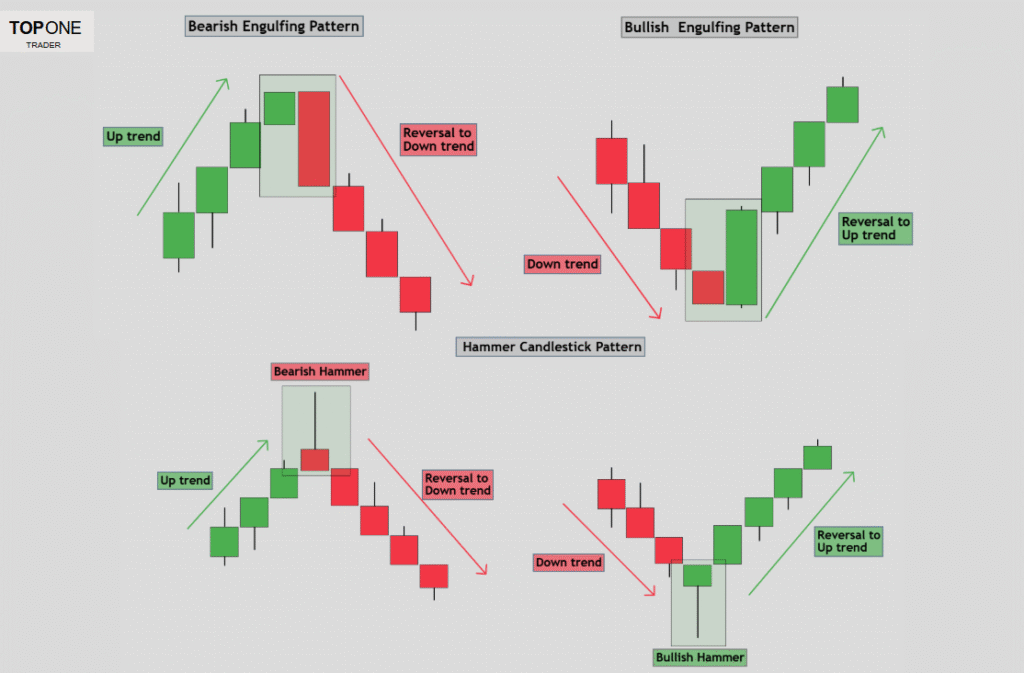
Key patterns include the Bullish and Bearish Engulfing and the Hammer. A Bullish Engulfing signals buying strength, while a Bearish Engulfing suggests a potential reversal at the top of an uptrend. The Hammer, with its long wick and small body, indicates price rejection and can signal a shift in momentum, whether bullish or bearish.
Candlestick patterns are more reliable on higher time frames (4H, daily, weekly) as they provide clearer signals. On lower time frames, however, they can produce false signals due to market noise.
To enhance the reliability of candlestick patterns, especially on lower time frames, it’s important to combine them with other tools like trendlines, key levels, and supply/demand zones. These tools can act as confirmations, strengthening trade setups and increasing the likelihood of successful trades.
How to Use Patterns Properly in Trading
Recognizing chart patterns is a strong skill, but using them effectively in real trading conditions is what truly sets successful traders apart. Trading patterns alone don’t guarantee profits, they need to be used with proper context, confirmation, and discipline.
Patterns Are Only Part of the Puzzle
Chart patterns reflect market psychology, but they shouldn’t be used in isolation. Always combine them with confirmation tools like candlestick patterns, volume, or indicators. This helps filter out low-probability setups and boosts accuracy.
Time Frames and Trend Context
Always use multiple time frames when conducting market analysis, especially in day trading.
A setup on the 15-minute chart may look promising, but if it goes against the prevailing trend on the 4-hour or daily chart, it’s more likely to fail. Trends are a core element of market structure and help traders understand where the market is heading.
The higher the time frame, the more respected the trend, trading patterns, and key levels tend to be. The best way to identify trends is through trend lines and market structure, which provide visual clarity and directional bias. Use higher time frames to define the overall trend and key zones, and lower time frames to pinpoint precise entries and confirmations.
By applying multiple time frame analyses, you can anticipate market movements with greater confidence. Patterns like bullish flags or double bottoms are most effective when they align with the dominant trend direction, reinforcing the reliability of your market analysis.
Use Volume and Candlestick Confirmation
Volume confirms the strength behind a price move. A breakout accompanied by strong volume is more likely to succeed than one with weak volume. Candlestick patterns—such as bullish engulfing or hammer formations—can also serve as strong confirmation signals, especially when they appear at key levels like support, resistance, demand zones, or during breakouts.
Key Levels add conviction
Chart patterns are more significant when they form near key levels, such as previous support or resistance, supply and demand zones, psychological levels, or Fibonacci retracement levels.
For example, a double top forming just below a major resistance zone that has been tested multiple times is far more likely to play out than one that appears in the middle of a random price area.
Stacking confluences like key levels and other technical tools helps increase the reliability and probability of your trades.
Indicators and Fundamental Analysis
Technical indicators like RSI and MACD can strengthen your pattern-based setups. For example, RSI divergence during a pattern, like a falling wedge, can signal a potential opportunity with strong momentum.
Always consider fundamentals too. News events drive price and can explain market dynamics, often overriding technical setups. A pattern may look perfect, but high-impact news like interest rate decisions or inflation data can cause sharp, unexpected moves. Always check the economic calendar and avoid trading blindly around major events.
Stay ahead of the market with Top One Trader’s Economic Calendar. Track key economic events and news releases to make informed trading decisions. Stay prepared and trade with confidence today!
Entry, Exit, and Risk Management
Spotting a pattern is just the first step; execution is key. Look for breakout points with confirmation, such as a strong candle close and rising volume. Set profit targets based on pattern size, like measuring the distance in a double bottom and projecting it upward.
Use the OTE (Optimal Trade Entry) strategy, waiting for a pullback to a Fibonacci retracement zone (61.8%-79%) for more precise entries and tighter stop-losses. Always use a stop-loss to protect your account, especially if you are trading using a prop firm account, they have strict drawdown rules.
Keep risk small per trade, ideally 0.25%-0.5%, to avoid exceeding drawdown limits. Aim for a reward-to-risk ratio of at least 2:1, but higher ratios may be possible with tested setups.
Backtest and Build a Strong Mindset
Before trading live, backtest your strategy thoroughly. This helps you understand your win rate, average risk-to-reward ratio, and potential drawdowns. It also reveals which markets and time frames your strategy performs best on. With solid backtesting data, you’ll have more confidence in your edge and be better prepared to execute your plan with discipline.
But even the best strategy won’t save you if your mindset isn’t right. Fear, greed, and impatience can ruin great setups. Building strong trading habits—like discipline, patience, and emotional control—is just as important as mastering technical skills.
Here are some quick mindset tips:
Don’t chase trades. Let the setups come to you.
Accept losses. They’re part of the game; Focus on long-term consistency.
Focus on the process, not the outcome. Stick to your plan, win or lose.
Journal every trade. Review both your wins and losses to improve continuously.

Conclusion:
Trust the Patterns, Respect the Process
Understanding market behavior through identifying chart patterns gives traders a clearer view of price action. While recognizing trading patterns – especially trend continuation patterns – can help you anticipate market movements, success doesn’t come from patterns alone.
It’s about how you incorporate them into your trading plan with patience, discipline, and strong risk management. Use confirmation tools, and technical indicators stay aligned with the bigger picture, and maintain control of your mindset.
Trading is a continuous journey. With the right tools, mental resilience, and proper risk management, you can make these patterns work for you and ultimately succeed in the financial markets.
Take your trading to the next level with Top One Trader. The platform supports various strategies and provides educational resources to help you build and refine your own strategy. Start trading today and gain access to the tools and support needed for success!
Inverse Fair Value Gap Explained
Why do so many traders, even those with access to large capital in prop firms, struggle to maintain profitability? The answer often lies in the absence of a clear strategy, a strict risk management plan, and an undisciplined mindset. Prop firms offer significant funding opportunities, but without a plan, traders risk blowing their accounts.
There are so many trading strategies, each with its strengths and weaknesses. In recent years, one concept has gained significant popularity—the Fair Value Gap (FVG) and its refined version, the Inversion Fair Value Gap (IFVG).
But the question remains: Can IFVGs be used as a reliable trading strategy? This is what we’re going to find out in this article.
Understanding Fair Value Gaps (FVGs)
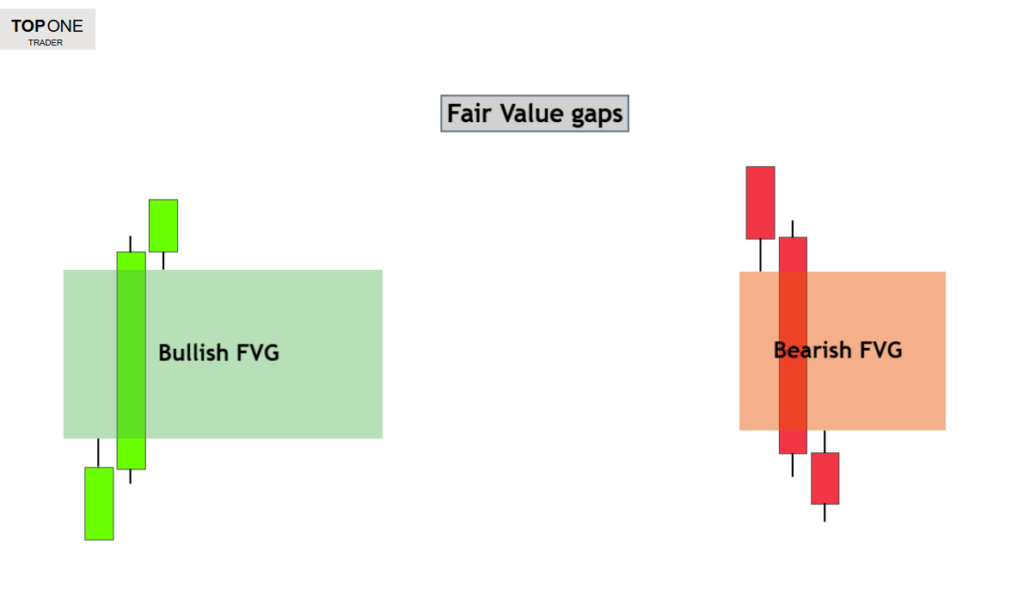
Fair Value Gaps (FVGs) are market inefficiencies that occur when there is a strong price movement, leaving a gap between consecutive candles. These gaps represent an imbalance between buyers and sellers, often serving as key areas where price may revisit before continuing in the initial direction. Traders use FVGs to identify points of interest in the market.
FVGs can be classified as:
- Bullish fair value gap – Formed when an aggressive bullish move leaves a gap, indicating strong buying pressure. The price often retraces to this zone before resuming the upward trend.
- Bearish fair value gap – Created during a sharp bearish move, signifying strong selling pressure. The price tends to revisit this area before continuing lower.
These gaps act as magnets for liquidity, making them valuable tools for traders looking for precise entries and exits.
Examples of bullish and bearish FVGs

Explanation of Inversion Fair Value Gaps (IFVGs)
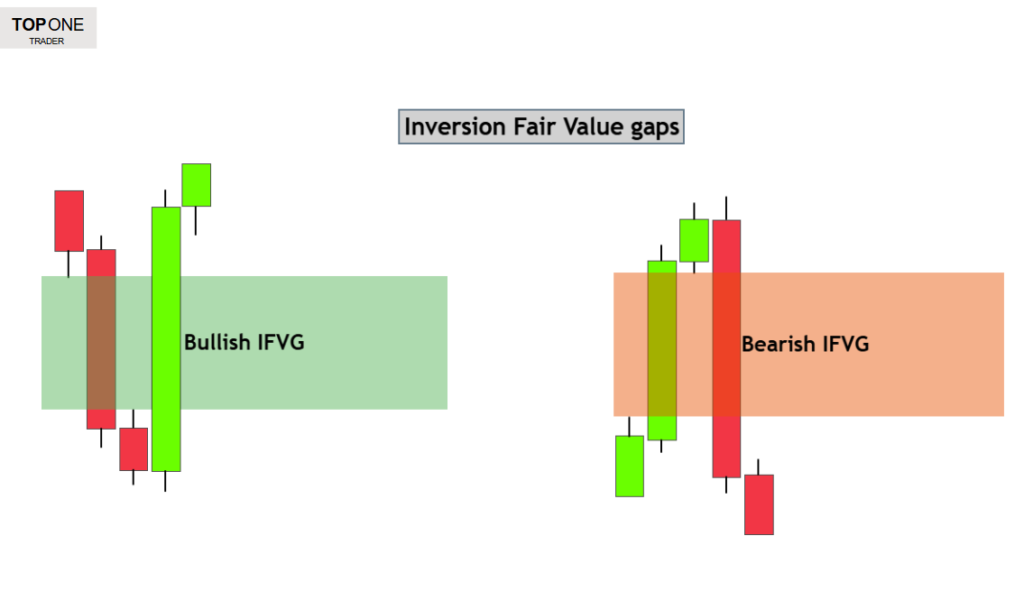
Inversion Fair Value Gaps (IFVGs) take the concept of FVGs a step further by introducing a dynamic shift in how price interacts with these gaps. Unlike traditional FVGs, which are expected to get filled and lead to continuation in the original direction, IFVGs occur when the price invalidates an existing FVG but then respects it in the opposite direction.
This shift happens when market conditions change and liquidity rebalances, causing a previous FVG to act as a new point of interest, but in reverse. Traders utilize IFVGs to identify trend shifts and potential reversals with high precision.
There are two types of IFVGs:
- Bullish IFVG – A previously bearish FVG that gets invalidated and turns into a bullish opportunity, indicating a shift in market structure and potential upside momentum.
- Bearish IFVG – A previously bullish FVG that flips into a bearish signal, showing strong downside pressure and a likely trend reversal.
Having a clear strategy is essential, but you need capital to turn that strategy into profits. Top One Trader provides you with the capital and equips you with the essential tools to trade successfully. Sign up today to get your funded account.
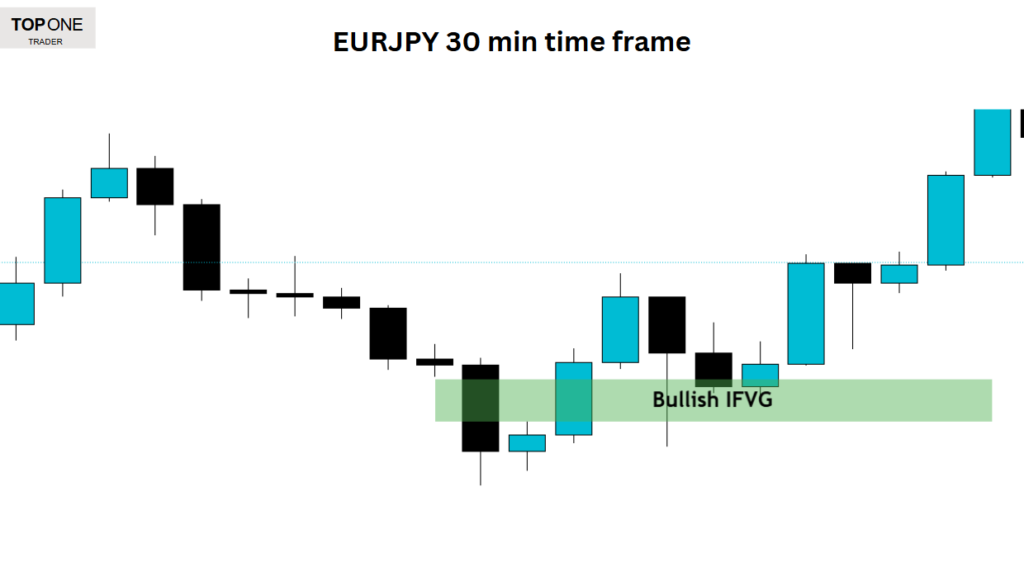
Example of a bullish IFVG
Building a Strategy Around Inversion Fair Value Gaps (IFVGs)
Mastering the identification and use of IFVGs allows traders to refine their strategies, enhancing their ability to spot high-probability trade setups while managing risk effectively. By combining IFVGs with market structure and liquidity analysis, traders can improve their chances of maintaining consistency in prop firm challenges and beyond.
Trend Analysis
Developing a robust trading strategy that centers on inversion fair value gaps (IFVGs) starts with aligning your trades with the prevailing market trend. Whether observing a bullish momentum or a bearish run, it’s essential to use IFVGs within the context of the existing directional bias. By combining these gap signals with market structure and confirmations from higher time frames, you create a more reliable gap trading strategy.
Liquidity analysis
Consider the role of buy-side and sell-side liquidity in your trading decisions. Key liquidity zones, such as previous highs and lows, often mark areas where fair value gaps (FVGs) tend to form. When you observe a liquidity sweep, whether it results in a bearish or bullish fair value gap, it signals that the market is actively rebalancing.
By focusing on these zones, you can identify where an Inversion Fair Value Gap (IFVG) might form after a failed FVG, offering a potential reversal signal.
Confirmation entries
Confirmation entries are a vital part of this strategy. Instead of rushing in as soon as an IFVG appears, wait for a clear Change of Character (CHOCH) to validate the signal, which provides clear evidence of a price reversal.
Once this shift is confirmed, placing a limit order at the borders of the IFVG can offer an optimal entry point. This method provides a high-probability setup and ensures that you’re not trading based on false signals or a failed Inversion Fair Value Gap.
Risk management
Risk management is equally critical, especially in prop firm environments where drawdown limits are strict. Always set your stop loss just beyond the invalidated gap or the most recent swing high/low to protect your capital.
A solid approach is to take profit at key levels; consider taking portions of your profit as the price closes at significant zones, whether in a bullish or a bearish move. Keeping risk per trade between 0.25% and 0.50% is advisable.
Diversify your trades across different markets, such as forex, commodities, and stocks, to avoid overexposure. This diversification, combined with careful position sizing and risk management, enables you to maintain consistency even when faced with occasional false signals or volatility shifts.
Backtesting
Finally, backtesting your strategy across various markets and time frames is important. Backtesting helps refine your approach. By analyzing historical data, you can determine which market conditions favor the formation of bullish IFVGs versus bearish IFVGs and adjust your trading decisions accordingly. This rigorous process not only solidifies your strategy but also builds the confidence needed to execute trades in real time.
How to Trade IFVGs – Real Examples
Example 1
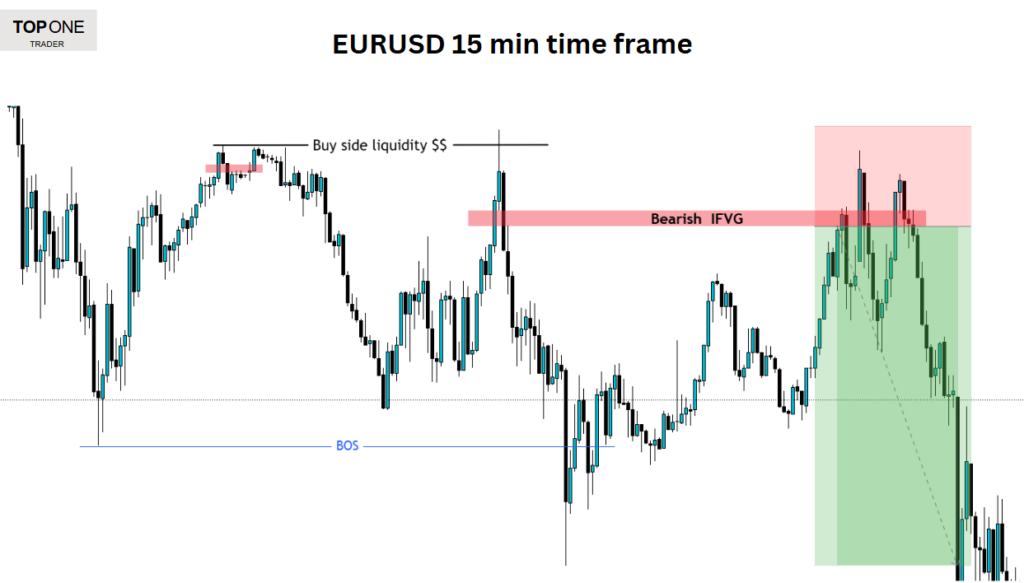
In this chart, price initially took out buy-side liquidity before forming a bearish Inverse Fair Value Gap (IFVG). Instead of filling the imbalance fully, the price reversed sharply, signaling strong selling pressure. Following this, the market broke the previous low, creating a Break of Structure (BOS) and confirming a shift to a downtrend.
The opportunity here is to place a sell limit order just below the IFVG, with a stop-loss above the previous high and a take-profit target at the most recent low. This trade setup provided a 3.3 to 1 reward-to-risk ratio.
Example 2
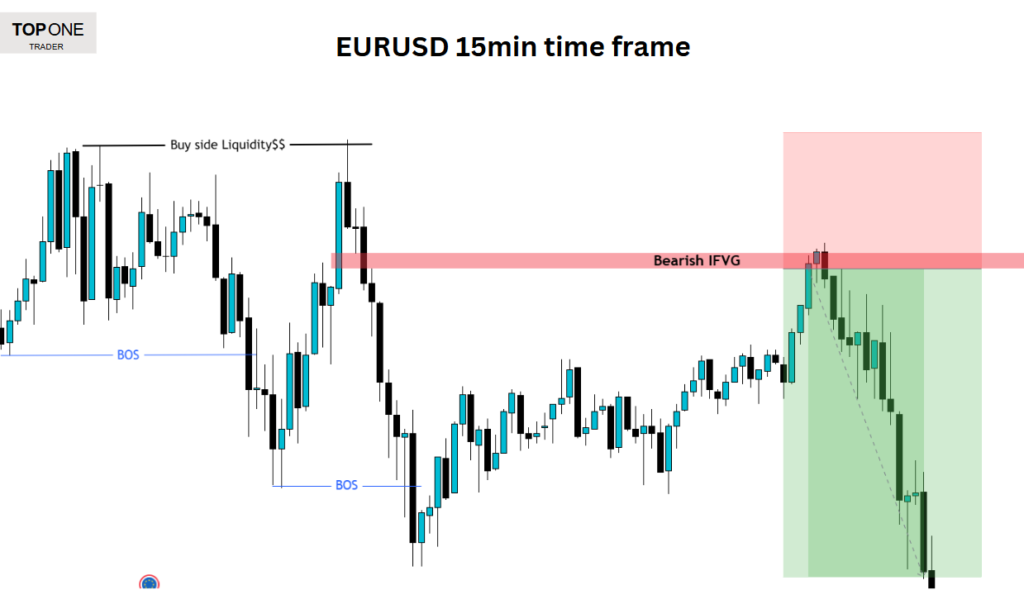
In this scenario, price first made a break of structure (BOS) to the downside, indicating the strength of sellers. It then retraced, sweeping buy-side liquidity before forming a bearish Inverse Fair Value Gap (IFVG)—a key zone for potential short entries. After that, the price dropped again, making another break of the structure, further confirming the bearish trend.
This setup had multiple confirmations, making it more likely to succeed. The trade involved placing a sell limit below the IFVG, with a stop-loss above the previous high and a take-profit at the recent low, offering a 2.25:1 risk-to-reward ratio.
Example 3
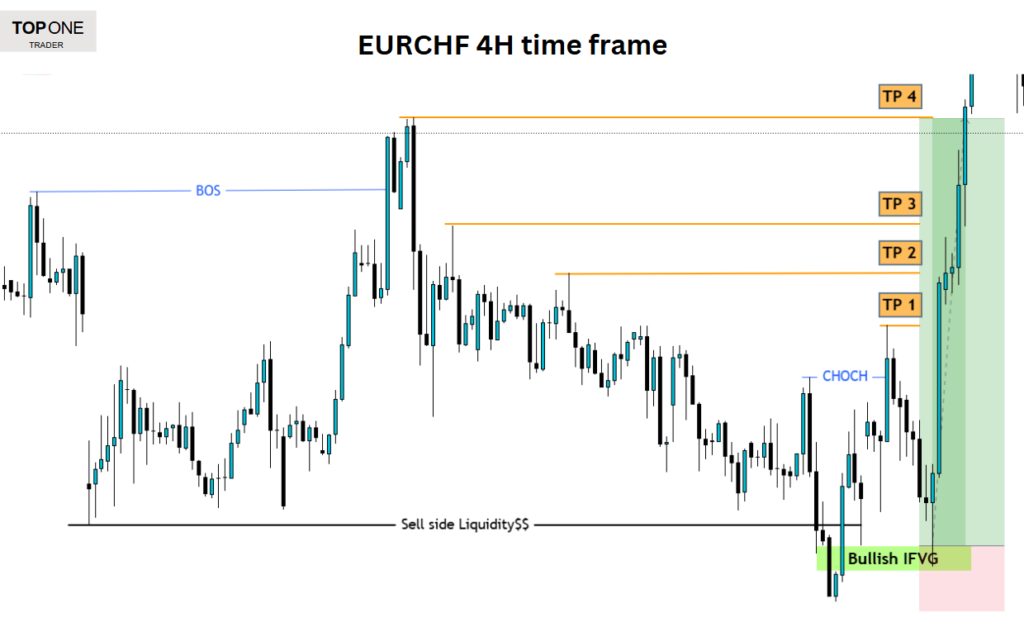
In this case, price initially made a Break of Structure (BOS) to the upside, confirming bullish intent. It then retraced, sweeping sell-side liquidity, and formed a bullish Inverse Fair Value Gap (IFVG)—a strong demand zone.
A Change of Character (CHOCH) followed, signaling a shift in momentum. The market then respected the bullish IFVG and pushed higher, reaching multiple take-profit (TP) levels.
This setup had strong confirmations:
- Liquidity sweep before the reversal
- CHOCH confirming trend shift
- Bullish IFVG acting as a demand zone
With these factors aligning, the probability of success increased, leading to a clean bullish move hitting TP 4.
In this case, you have multiple targets as price formed several internal highs that can be used as take-profit levels. Your risk management plan will determine how you approach these targets.
For better and safer results, you can take a portion of your profits at each potential TP level. For example:
- Take 40% of profits at TP1
- Take 30% of profits at TP2
- Take 20% of profits at TP3
- Take 10% of profits at TP4
This scaling-out method ensures you stay profitable even if the market reverses and hits your stop loss.
Final Thoughts
Incorporating Inversion Fair Value Gaps (IFVGs) into your trading strategy can provide traders with powerful tools for high-probability setups. While the concept of FVGs and IFVGs offers a structured approach to identifying potential market shifts, it’s important to remember that no strategy is foolproof. A clear trading strategy, strict risk management, and a disciplined mindset are crucial to becoming a consistently profitable trader.
By combining IFVGs with trend analysis, liquidity, confirmation entries, and sound risk management, traders can refine their approach and enhance their chances of success, especially in challenging environments like prop firm trading. Always backtest your strategies and remain adaptable to changing market conditions to optimize your performance and ensure long-term profitability.
Take your trading to the next level with Top One Trader. The platform supports various strategies and provides educational resources to help you build and refine your own strategy. Start trading today and gain access to the tools and support needed for success!
Bull Market vs Bear Market
One of the most important skills a trader can learn is recognizing market direction. Understanding whether the market is rising (bullish) or falling (bearish) will change the way you trade.
But what are these terms, and why should you care about them? In this article, we are going to outline the main differences between bull and bear markets, explain what these markets look like in real-world scenarios, and show you how to effectively use technical and fundamental analysis to spot them.
What is a Bull Market?
A bull market typically describes a period of time in which the price of an asset, such as stocks, commodities, or indices, is continually rising. In a bull market, values are rising, and investor and trader confidence, optimism, and the economy related to this asset are healthy. In this environment, traders and investors line up to buy rather than sell, and the prices continue to rise.
Bull Market example: TSLA Stock – March 2020
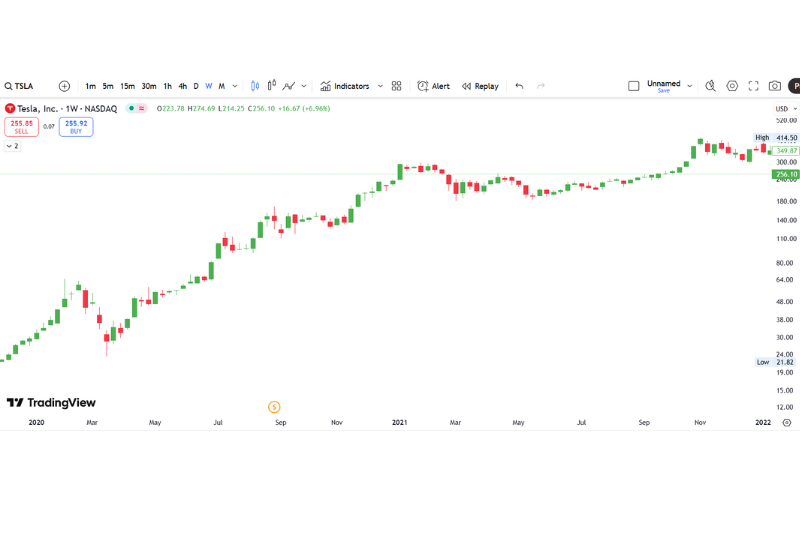
Consider Tesla’s stock (TSLA) after the COVID-19 crash in March 2020. Following a sharp dip, the stock began a dramatic recovery, fuelled by strong earnings, rising interest in electric vehicles, and growing demand for green energy.
By early 2021, TSLA had surged nearly fivefold to around $300 per share, eventually peaking at approximately $414 later that year. Much of this growth was driven by optimism around Tesla’s innovation, expansion plans, and the broader momentum in the EV market, which led many investors to see the stock as a bet on the future.
What is a Bear Market?
A bear market is the exact opposite of a bull market. It’s a term for an extended period when the price of one or more assets falls from a recent peak. Most of the time, positive investor sentiment brings in a bull market, but in a bear market, it leads to negative investor sentiment, causing selling to become widespread.
Economic downturns, recessions, geopolitical issues, and the like may lead to the expectation that a bear market is on the way.
Bear Market example: S&P 500 – April 2025
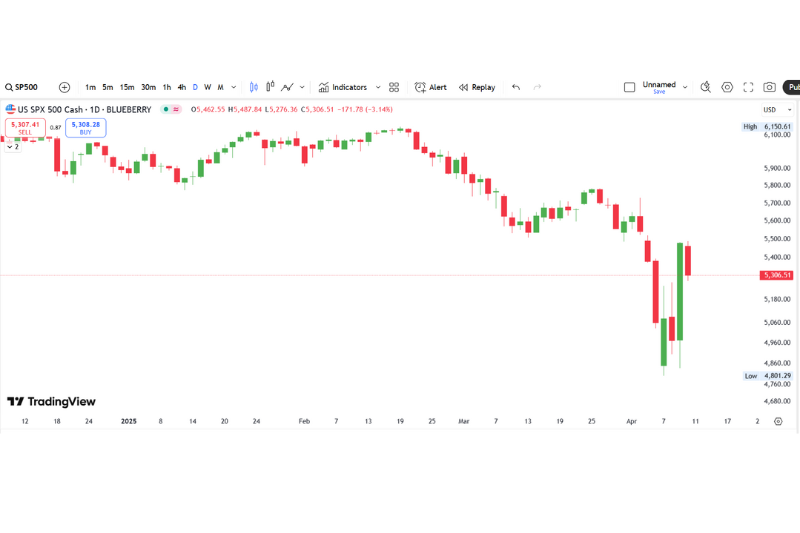
In early 2025, the markets entered a bear phase, driven by a series of negative economic factors. One significant event was a trade dispute between the U.S. and China, with both countries imposing significant tariffs on each other’s products. The uncertainty surrounding this economic conflict led to general panic in the markets.
The S&P 500, one of the most popular indexes in the United States, declined and had lost over 20 percent by April 2025. Corporate earnings weakened, inflation fears were rampant, and global economic growth slowed, leading to bearish pressure on the market. Investors, concerned about more losses, began to sell stocks related to the S&P 500, pushing the index price lower.
Why do traders need to know market direction?
Traders can gain an advantage in the market by knowing whether the market is in a bull or bear phase, enabling them to trade with the trend and identify high-probability setups. In a bullish trend, it’s better to look for buying opportunities; in the opposite scenario, if traders spot a bearish trend, they should search for selling opportunities.
Market conditions vary constantly, and traders with a good understanding of these conditions are better equipped to make informed decisions, minimize risks, and capitalize on trends. In addition, continuously monitoring the overall direction of the market enables traders to better assess risk, stay focused, and think clearly even when the market is unstable.
How to Identify Bull or Bear Markets?
Market direction can be determined through both technical and fundamental analysis.
Technical Analysis Tools
Trend Lines
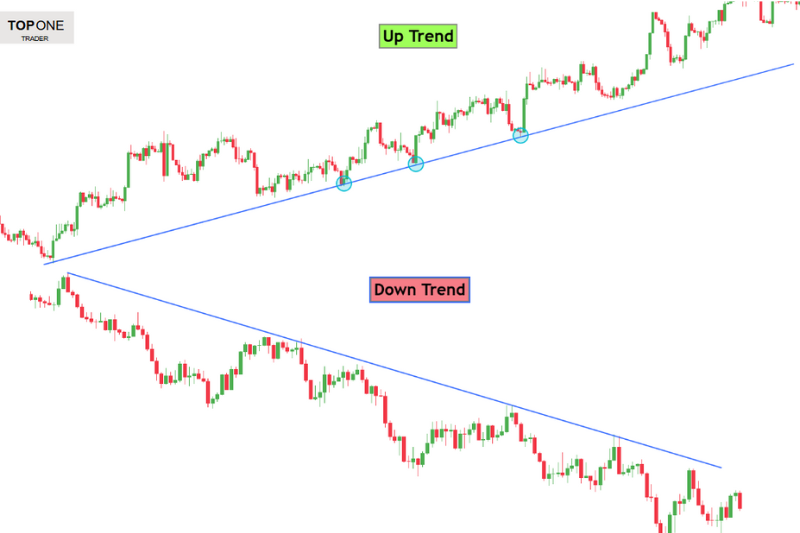
Trend lines are simple instruments relative to the identification of market trends. In a bull market, prices create higher highs and higher lows, resulting in an upward trend line. In a bearish market, we see lower highs and lower lows that create a downward trend line. It guides traders on when to buy or sell.
Moving Averages
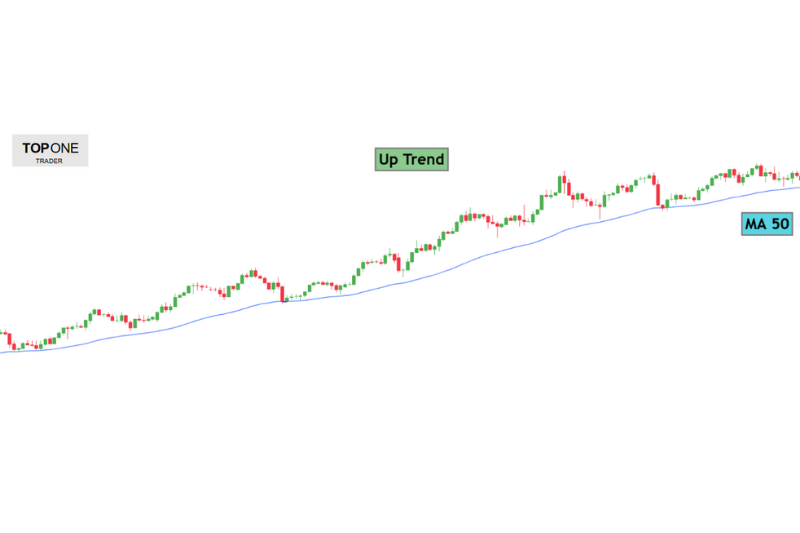
Moving averages (MAs), especially the 50-day and 200-day MAs, help to know market direction. During a bullish market, prices remain above these moving averages, indicating an uptrend. In a bear market, on the other hand, prices remaining below the moving averages indicate a downturn.
Market Structure
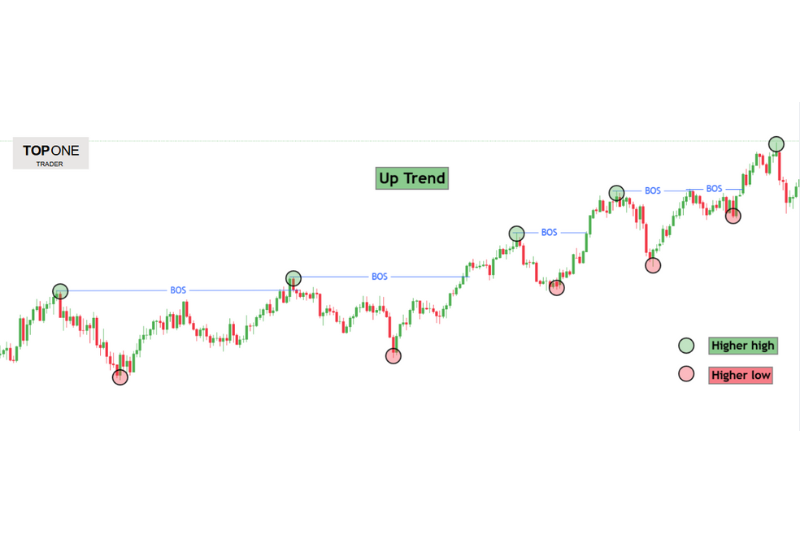
Market structure is the way in which price moves. A bull market is characterized by a series of higher highs and higher lows, whereas a bear market exhibits lower highs and lower lows. Understanding market structure helps traders identify where the price is going and where potential trend reversals are likely to form.
Importance Of Time Frames
Time frames are important in determining bull or bear markets because trends can differ greatly based on the time horizon you use to analyze them. Higher time frames (daily, weekly, or monthly charts) give an overall view of the long-term trend in the market as well as help determine if the market is in a bull or bear market. Trends on higher time frames are more reliable, tend to be respected by the market, and are harder to reverse.
These time frames are especially beneficial to long-term market drivers, such as investors and swing traders. Conversely, shorter time frames like 15 min or 5 min unveil small market fluctuations, commonly beneficial for day traders or traders that want to ride shorter-term price movements during the overall trend.
Looking at multiple time frames gives traders a clearer picture of how short-term price action fits into the bigger trend. This can help them time their entries and exits more effectively and figure out whether the broader market is in a bull or bear phase. It also helps them navigate between different time frames with more confidence and avoid getting false signals.
Fundamental Analysis
- Economic Indicators
Economic data is essential in determining market trends, with indicators like GDP growth, employment rates, inflation rates, and consumer sentiment. Bull markets generally follow periods of strong economic growth and low unemployment. Monetary easing usually prevails in a bull market, while a weak economy, high unemployment, and slow growth often signal the start of a bear market.
- Interest Rates
Other variables affecting market trends are largely interest rates, especially in the forex market (currencies). Low interest rates reduce the cost of borrowing, encouraging investments, and have historically contributed to a bull market. But higher interest rates are more likely to raise the cost of borrowing, which may reduce economic activity and start a bear market.
- Corporate Income and Valuations
Corporate profits are the main drivers of bull markets. Strong earnings signal company growth, and investors make investments based on their confidence. Poor earnings or high valuations can mark the end of a bull market and the beginning of a bear market. As corporate performance declines or stocks become overvalued, a correction or transition to a bearish trend may occur in stock prices.
Stay ahead of the market with Top One Trader’s Economic Calendar. Track key economic events and news releases to make informed trading decisions. Stay prepared and trade with confidence today!
How to Predict and Identify Shifts in Market Trends

Predicting market shifts from bullish to bearish, or vice versa, can significantly enhance trading strategies. By utilizing both technical and fundamental analysis, traders can identify these shifts early and adjust their positions accordingly.
Technical Analysis Indicators
- Breakouts
Breakout Trends with Big Candles, or when Prices move above or below major support or resistance levels, often indicate the shift in trends and the beginning of a new one. These large candlesticks show strong momentum towards confirming bull or bear movements in the market.
- Market structure shift
A change of character (CHOCH) followed by a break of structure (BOS) is a strong indication that the trend may reverse. For example, in an uptrend, a CHOCH occurs when price breaks a higher low, suggesting a shift from bullish to bearish, followed by a BOS to the downside, which helps confirm the trend change.
Fundamental Analysis Indicators
- Economic Indicators: Strong economic data, such as positive GDP, low unemployment, or rising consumer confidence, often signals the start of a bull market. Conversely, weak data, rising inflation, or high unemployment suggest a bearish trend.
- Interest Rates: Low interest rates encourage investment, supporting a bull market, while rising interest rates tend to reduce economic activity, potentially leading to a bear market.
- Corporate Earnings: Strong earnings reports from companies signal a potential bull market, while poor earnings or lowered forecasts may indicate the start of a bearish phase.
- Geopolitical Events & Market Sentiment: Geopolitical events can influence market sentiment, with instability often leading to a bear market and stable conditions fostering a bullish environment.
Conclusion
Recognizing bull and bear markets is essential for making smarter decisions, whether you trade forex, commodities, or the stock market. These market cycles affect everything from stock prices and investor confidence to the global economy.
Bull markets tend to bring rising share prices, strong corporate earnings, and more optimism, while bear markets are often linked to a weak economy, falling stock prices, and fear-driven selling. While the average bull market lasts longer than the average bear market, both are natural parts of market changes.
Using both technical and fundamental analysis can help you better spot trends and manage your funds wisely by building a diversified portfolio over time. But always remember: trading and investing involve risk. Staying informed and adaptable is key to protecting your money and making more money, no matter where the market is headed.
Take your trading to the next level with Top One Trader. The platform supports various strategies and provides educational resources to help you build and refine your own strategy. Start trading today and gain access to the tools and support needed for success.
Falling Wedge Pattern: Spotting Breakout Opportunities in Any Market
In trading, emotions are often a trader’s worst enemy. The most successful traders rely on disciplined strategies rather than gut feelings. A clear strategy is invaluable, as it helps identify high-probability setups with defined entry and exit points.
There are many trading strategies, and today we’ll focus on patterns—specifically, the falling wedge pattern, a powerful model that predicts price movement and signals either a reversal or continuation.
The falling wedge forms when an asset’s price moves between two converging downward-sloping trendlines. The upper trendline connects a series of lower highs, while the lower trendline connects a series of lower lows at a slower decline. This pattern is particularly valuable because it often marks a turning point where selling pressure weakens, creating opportunities for substantial upside moves.
Understanding the Two Types of Falling Wedges
The falling wedge can appear in two distinct market contexts, each with its own implications:
1. The Continuation Pattern
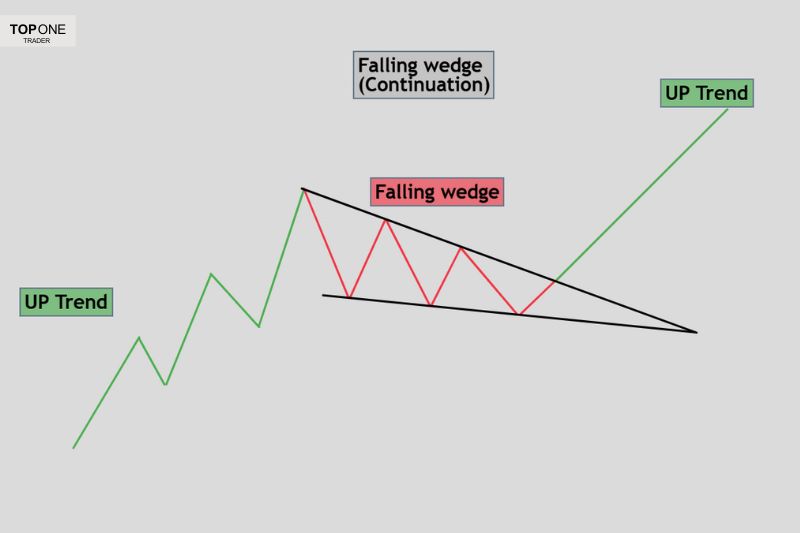
When a Falling wedge occurs during an established uptrend, the price consolidates temporarily before the upward movement resumes. This phase acts as a breather for the market, with the price contracting within two lower trend lines.
During this consolidation, trading volume gradually decreases, signaling that sellers are losing momentum and failing to push prices significantly lower. The price action forms lower highs, but the lows decline at a slower rate, creating a narrowing wedge shape. This indicates that while sellers are present, their strength is fading compared to that of buyers.
Once consolidation is complete, the price eventually breaks out above the upper trendline, confirming the continuation of the uptrend. This breakout is typically accompanied by an increase in volume, reinforcing the idea that buyers are regaining control and pushing the price higher.
2. The Reversal Pattern
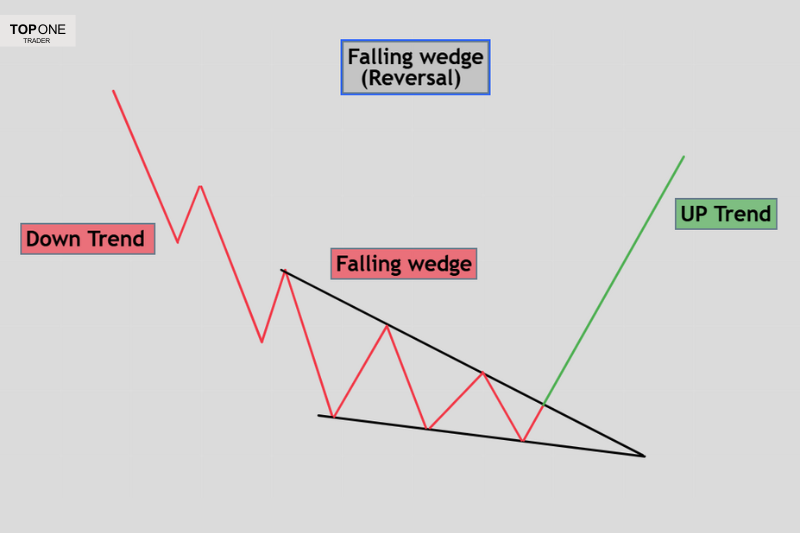
When a falling wedge appears in a downward trend, it often signals a trend reversal. While the price continues forming lower highs, the lows drop more gradually along the lower trendlines, indicating weakening selling pressure as buyers start stepping in.
As the wedge forms, trading volume decreases, indicating market indecision. Sellers struggle to push prices lower, while buyers gradually gain strength. Once the price breaks above the upper trendline with increased volume, it confirms the breakout, signaling a potential trend reversal. Traders can enter a long position upon confirmation and capitalize on the move.
How to Trade the Falling Wedge Effectively
For Continuation Setups:
The entry strategy should be patient and disciplined when a falling wedge pattern occurs. Wait for the price to close above the upper trendline, rather than just touching it. Many false breakouts occur when prices briefly spike above resistance only to fall back. The ideal confirmation occurs when this breakout is accompanied by a significant increase in volume, signaling strong buying pressure.
This breakout serves as a confirmation signal for traders, presenting a high-probability opportunity to enter a long position. The best trade setup involves waiting for the breakout, confirming it with volume, and placing an entry point at or just above the broken trendline. To manage risk, a stop-loss should be placed below the most recent swing low.
Examples
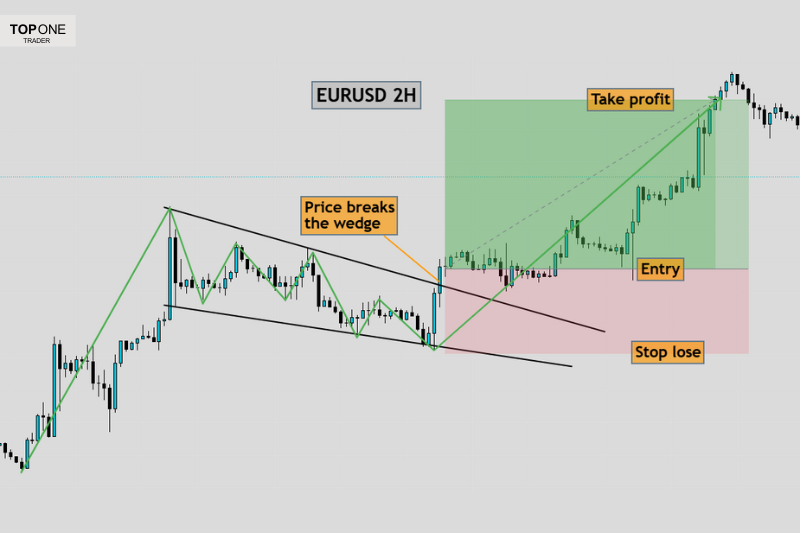
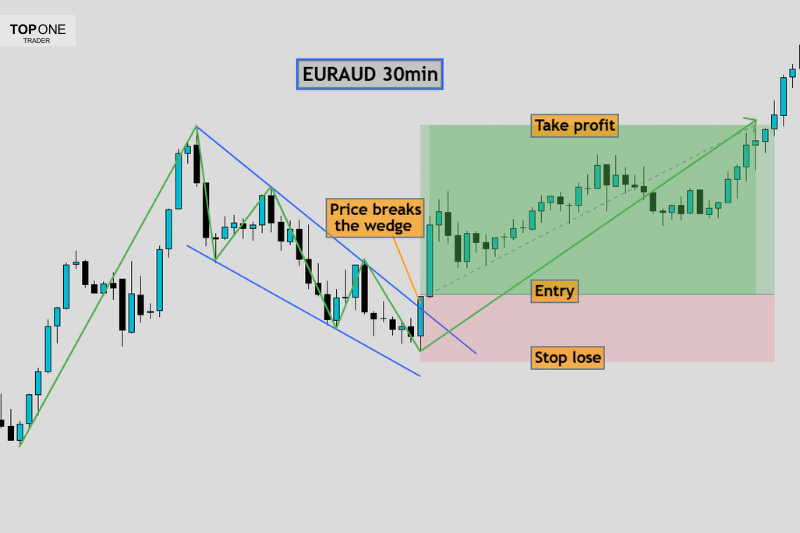
Having a clear strategy is essential, but you need capital to turn that strategy into profits. Top One Trader provides you with the capital and equips you with the essential tools to trade successfully. Sign up today to get your funded account.
For Reversal Setups:
The principles are similar but require extra caution. Since you’re attempting to catch a major trend change, it’s wise to wait for confirmation on higher time frames. Key areas on the 4-hour or daily charts carry more weight than those on shorter time frames. These key areas help identify potential reversals, which should be aligned with the falling wedge pattern for a stronger setup.
Stop-loss placement is particularly crucial for reversal trades. Conservative traders may place their stop-loss below the entire wedge formation for added security, while more aggressive traders could set it at the most recent swing low to allow for a tighter risk-reward ratio. The key confirmation of the reversal occurs when the price breaks above the upper trendline of the wedge, typically accompanied by a sharp increase in volume. This breakout signals that buyers have taken control and that a bullish trend shift is underway.
Examples
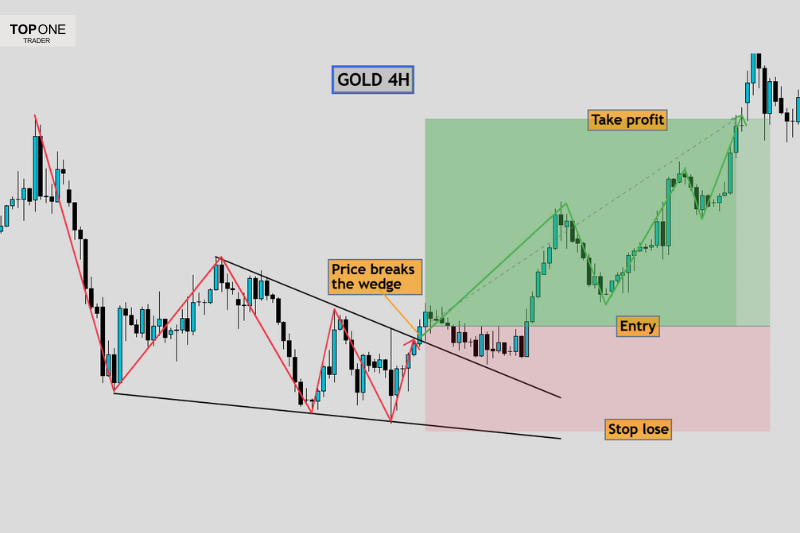
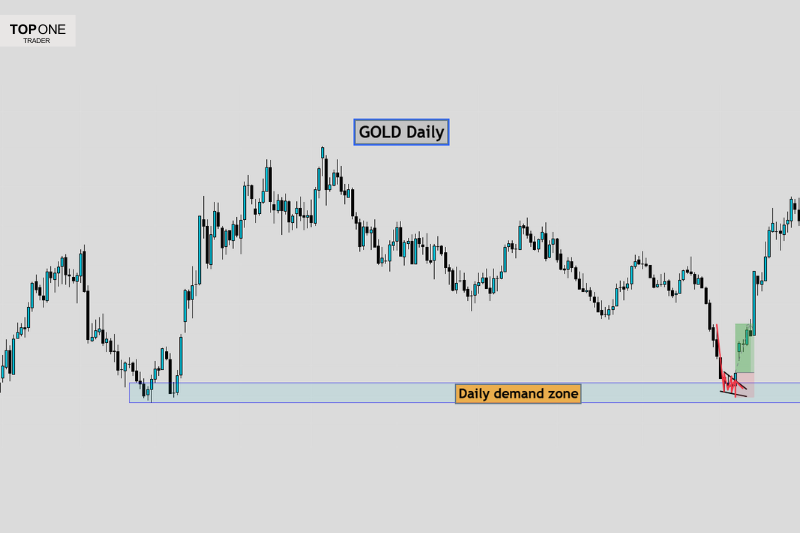
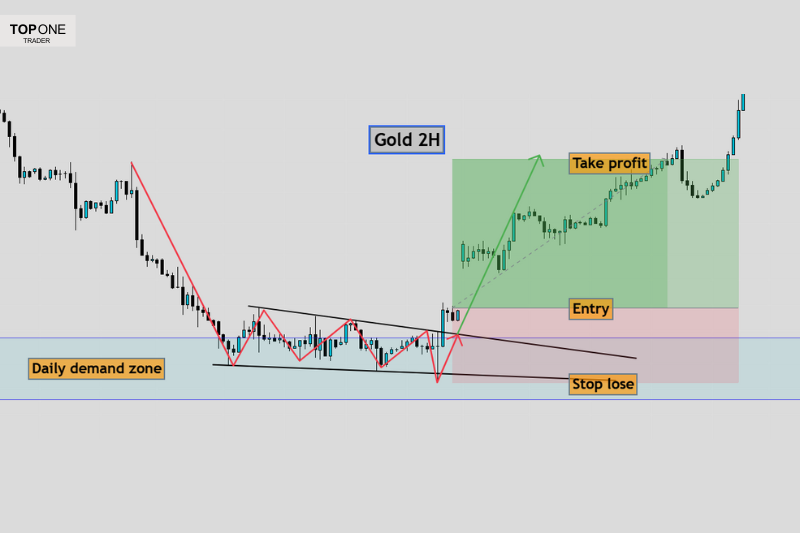
Essential Risk Management
Regardless of which variation you’re trading, strict risk management is non-negotiable. Always maintain at least a 1:2 or 1:3 risk-reward ratio, meaning your potential profit should be at least twice your potential loss. This approach ensures that even if only half of your trades are successful, you’ll still break even or remain profitable over time.
Position sizing should be calculated based on the pips you’re willing to risk in your stop-loss and your overall capital. For risk per trade, it’s recommended to risk between 0.25% and 0.5% per trade to protect your account, especially for prop firm accounts that have strict drawdown limits. Proper risk management helps sustain long-term consistency and prevents significant losses.
Use Top One Trader’s position size calculator to determine the ideal risk level for each trade. Take control of your risk management and trade smarter today!
Confirming Your Falling Wedge Trades: Essential Filters
While the falling wedge pattern itself provides a solid foundation, incorporating confirmation tools can significantly boost your success rate. These filters help separate high-probability setups from potential false signals.
Volume and candlestick
Pay close attention to the candlestick during the falling wedge breakout. A large bullish candlestick closing near its high suggests strong buying momentum and conviction. Specifically, a bullish engulfing candle during the breakout, combined with high volume, indicates that buyers are fully in control. This is a clear confirmation to enter a long position, as it signals the beginning of a potential bullish rally.
Trend Context Matters
For continuation setups, the strength of the preceding uptrend is crucial. The market should display a clear pattern of higher highs and higher lows, indicating strong bullish momentum before the wedge forms. If the prior trend is weak or choppy, the falling wedge pattern becomes less reliable, as the market may lack the necessary buying pressure to sustain a continuation.
A well-defined bullish trend increases the probability that the falling wedge is merely a temporary consolidation, rather than a deeper reversal. When the breakout occurs with strong volume, it confirms that buyers are reclaiming control, making the setup more valid for a long entry.
Key Levels Add Conviction
Key levels are essential when trading both continuation and reversal falling wedge patterns.
For continuation setups, if the wedge forms near a supply zone or a resistance level, the pattern may struggle to succeed. These areas attract sellers who can overpower buyers
attempting to break out, especially on higher time frames. In such cases, it’s best to avoid the trade and look for opportunities with less resistance.
For reversal setups, if the falling wedge occurs just above a strong support level that has held multiple times, it increases the chance of the wedge working well. This suggests buyers are stepping in, making a bullish move more likely. Always identify key support and resistance levels before trading the wedge to improve accuracy.
RSI divergence
When a falling wedge occurs, the price consolidates temporarily before resuming its upward movement. During this consolidation, RSI divergence can provide a powerful confirmation.
Even though the price forms lower lows within the wedge, the RSI forms higher lows, indicating that selling pressure is weakening while buyers are gradually gaining strength.
This divergence suggests that the downtrend is merely a correction rather than a reversal, and that buyers are ready to push the price higher once the consolidation phase is over. This divergence is especially significant when it appears on higher time frames, enhancing the reliability of the pattern.
Fibonacci for Precision Trading
Incorporating Fibonacci levels can refine both entries and targets. For entries, the Optimal Trade Entry (OTE) zone between the 0.618-0.786 retracement of the wedge’s height often provides low-risk opportunities after the initial breakout. For reversal targets, the 0.618 retracement of the prior downtrend is a key objective, while the 1.00 level offers a higher reward potential. Targeting these levels can maximize the reward-to-risk ratio.
Conclusion
A well-executed trading strategy relies on discipline, patience, a deep understanding of technical analysis, risk management, and a clear mindset.
The falling wedge chart pattern, whether signaling a reversal or continuation pattern, provides traders with a valuable framework for identifying high-probability setups. By combining this pattern with volume analysis, key levels, RSI divergence, and Fibonacci retracements, traders can enhance their decision-making and improve their risk-to-reward ratio.
However, no strategy can win every time. Proper risk management, including controlled position sizing and strict stop-loss placement, is essential to long-term success. The best traders don’t just chase signals—they refine their approach, wait for confirmation, and manage their risk effectively. By doing so, they turn patterns like the falling wedge into powerful tools for capturing market opportunities while protecting their capital.
Take your forex trading to the next level with Top One Trader. The platform supports various strategies and provides educational resources to help you build and refine your own strategy. Start trading today and gain access to the tools and support needed for success!
Bull Flag Pattern Strategy for Prop Firm Traders
Prop firm trading demands precision: tight risk management, sharp entries, and consistent setups. To meet the strict rules of prop firm challenges, traders rely on high-probability patterns that support disciplined execution.
One of the most effective setups is the bull flag – a bullish continuation pattern that forms after a strong upward move, followed by a brief consolidation before the trend resumes. It’s a clean, trend-following structure aligns well with prop firm risk models and offers clearly defined entry and exit points.
Because it reinforces trading with momentum rather than against it, the bullish flag can improve both win rate and risk-reward consistency. Its versatility across markets—forex, stocks, crypto—and time frames makes it a valuable tool for traders of all styles aiming to pass prop firm evaluations.
Understanding the Bull Flag Pattern
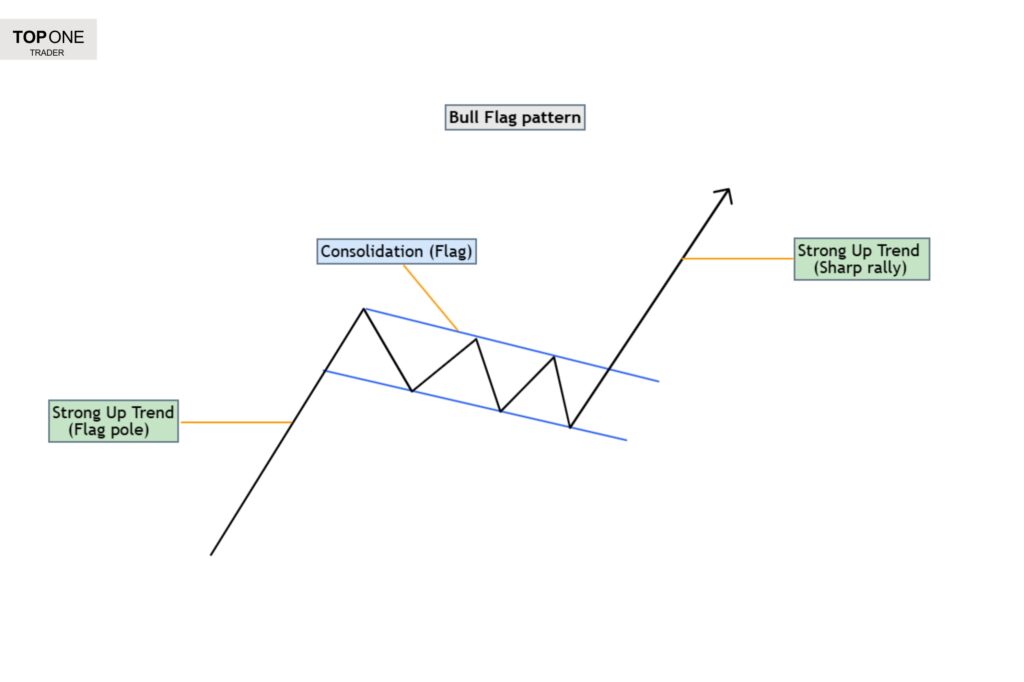
At its core, the bull flag pattern is composed of three main components:
1. Flag pole
It is a strong initial trend that marks the start of a bullish flag pattern, driven by strong buying momentum and high volume. This phase features large bullish candles with minimal pullbacks.
2. Consolidation
After the flag pole, the price enters a consolidation phase where a bull flag forms. During this phase, the market takes a breather before continuing its upward move. The consolidation should be marked by lower volume, indicating a temporary pause rather than a trend reversal.
3. Breakout and sharp rally
Once the price breaks above the consolidation area, a bull flag breakout occurs, signaling the continuation of the bullish trend. The price typically moves in a strong rally trend, driven by increased buying momentum as significantly more buyers enter the market. This movement presents an opportunity for traders to enter the market and capitalize on the upward momentum.
Becoming a funded trader is an exciting opportunity, but having the right skills is crucial! Top One Trader equips you with the essential tools and real capital in a supportive environment, allowing you to seize opportunities without putting your own money at risk.
How To Trade A Bull Flag
Identifying the bullish flag pattern requires careful attention to the price action and volume. There are generally two types of entries: an aggressive entry, which seeks to capture the move at the outset, and a confirmation entry, which waits for clear validation of the breakout then retest. Here’s how you can spot a bull flag in real-time:
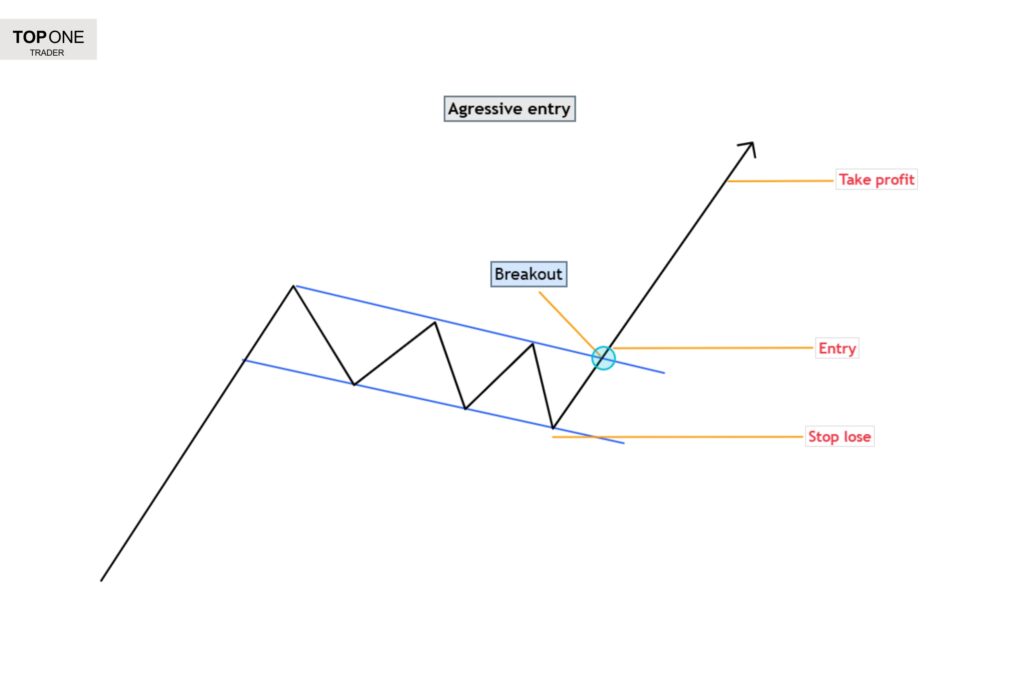
Aggressive entry
Spotting the Flagpole
The first step is to identify the flag pole, which is a sharp price rise that often occurs with increased volume. The flag pole represents a strong initial uptrend, indicating that buyers are in control of the market. For traders, this is the first signal that the market might be poised for a continuation.
Recognizing Consolidation
After the flag pole, the price will enter a consolidation phase, which is typically a brief pullback or sideways movement. The consolidation should be relatively shallow, with lower volume compared to the flag pole. This indicates that the market is taking a breather rather than reversing direction.
Confirming the Breakout
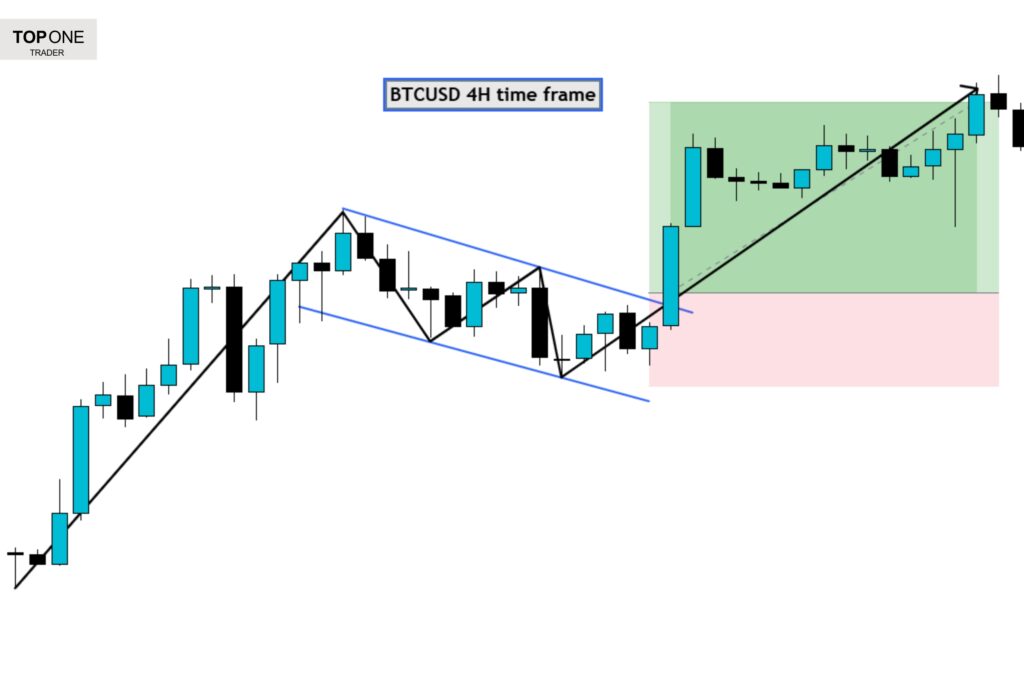
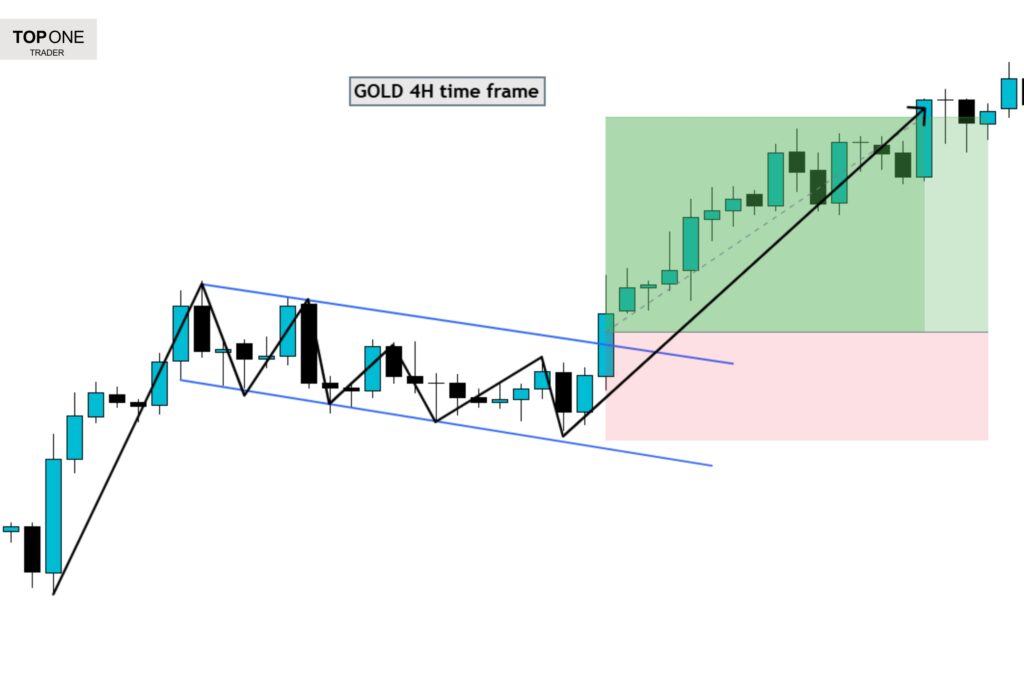
The key to trading the bull flag pattern is the breakout. Once the price breaks above the upper resistance of the consolidation, the bull flag breakout is confirmed. At this point, traders can look for an entry point, usually just above the resistance level, with a stop loss placed below the flag formation or, in some cases, below a key support level.
A breakout can be confirmed by a strong bullish candlestick pattern, such as a bullish engulfing candle, or with an increase in volume, indicating strong buying momentum.
Examples
Confirmation entry

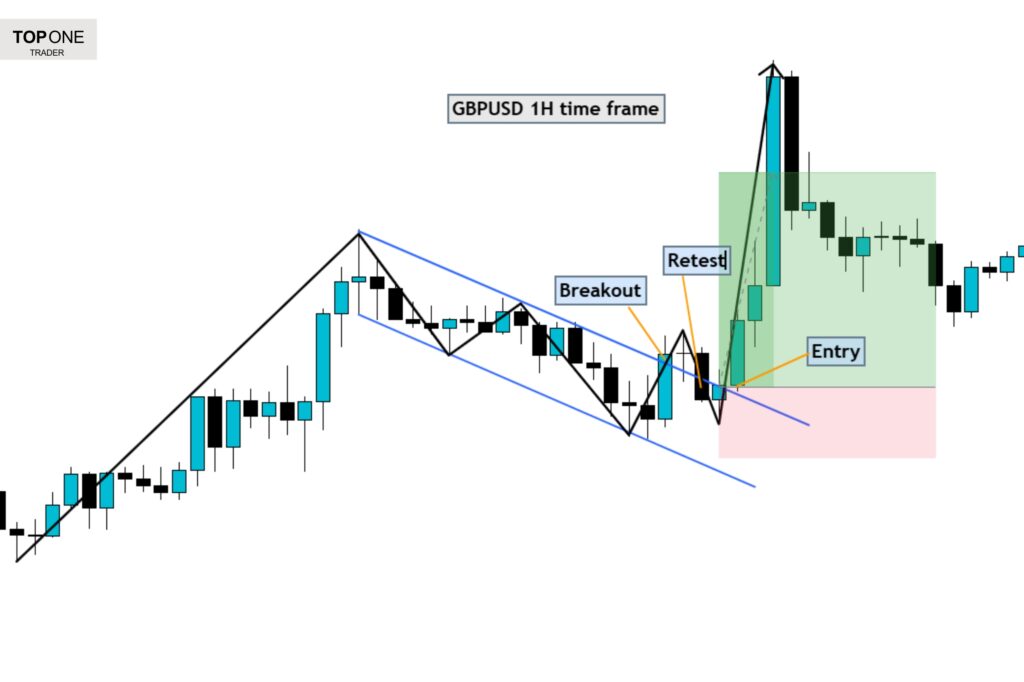
The confirmation entry follows the same basic rules as the aggressive entry, but with one key difference. Instead of entering immediately at the breakout, traders wait for the price to retest the broken resistance before entering the trade.
This small adjustment provides an advantage in terms of improving the reward-to-risk ratio, as it allows for a more precise entry with a smaller stop loss. By waiting for a retest, traders can enter at a better price while ensuring that the breakout is valid and not a false move.
Example
Note:
The aggressive entry can result in an average risk-reward ratio of 2:1, while the confirmation entry can offer around 3:1.
However, sometimes the price breaks the flag and goes into a sharp rally without retesting the resistance. This means traders using confirmation entries might miss trades, while those using aggressive entries can capitalize on these opportunities. Ultimately, deciding which type of entry to use depends on each trader’s trading plan and backtesting results to determine what works best for their strategy.
While the bull flag pattern is a bullish chart pattern, it’s important to mention that there are also bearish flag patterns, which occur during downtrends.
Common Mistakes & How to Avoid Them
Even with a well-defined strategy, traders often fall into common traps when trading the bull flag pattern. Here are some mistakes to be aware of and how to avoid them:
Entering Before Confirmation
One of the most common mistakes traders make is entering the market before the breakout is fully confirmed. While it may be tempting to anticipate the move, entering too early increases the risk of a false breakout.
Often, the price induces traders by breaking above the upper resistance of the flag with a wick before reversing, creating a false signal. To avoid this trap, always wait for the candle to close above the flag before entering. Depending on your strategy, you can then use either an aggressive entry or a confirmation entry to execute your trade.
Weak Flag Formations
Not all bull flag patterns are created equal. A strong bull flag formation consists of a clear flag pole, a tight consolidation, and a clear breakout. If the chart represents a brief consolidation period, or the flag pole is not strong enough, it might be better to pass on the trade. Always ensure that the bull flag pattern is well-formed before entering the market.
Trading Against Higher Time Frame Trends or Seller Levels
Trading against a bearish higher timeframe trend or entering at resistance or supply zones can be risky, even if a bullish flag forms on lower time frames. In such cases, despite the short-term bullish setup, you’re fighting the overall market sentiment, which increases the risk of getting trapped in a false move. Sellers at key levels can easily overpower short-term bullish momentum, causing a reversal.
To avoid trading against the trend, perform multi-timeframe analysis using weekly, daily, and 4-hour charts. Focus on bullish flags during uptrends, as they have a higher probability of success. Avoid using these patterns in downtrends or near strong resistance or supply zones, where sellers are likely to dominate.
Ignoring Volume
Volume is a critical indicator for confirming a bull flag breakout. When a bullish flag forms, you should see an increase in volume during the flag pole, followed by weaker volume during consolidation, and a rise in volume again at the breakout, leading to a sharp rally. Without sufficient volume at these key stages, the breakout may lack the momentum needed to sustain the move, potentially resulting in a weak breakout or even a false signal.
Additionally, volume can help you identify when to exit a trade. If you notice a decrease in volume while you’re in the trade, it could indicate that buyers are losing strength and a reversal may be imminent. This is a signal to exit and take your profits before the price potentially moves against you.
Poor Risk Management
The bull flag pattern fails, even with a strong setup, during unexpected market moves. Risking too much on a single trade or not using a stop loss can quickly wipe out your account.
To avoid this, always set your risk before entering a trade and ensure your position size matches your risk tolerance. Place stop-loss orders below the flag’s consolidation or a key support level to protect against false breakouts. Also, stick to a consistent risk-to-reward ratio to stay profitable over time, instead of relying on high-risk trades.

How to Use Bull Flag to Pass a Prop Firm Challenge
Passing a prop firm challenge requires a combination of trading strategy, risk management plan and emotional control. Here’s how traders can apply this bull flag pattern effectively:
Using Technical Analysis
The first step to successfully trading a bull flag is to use the right technical tools to confirm the upward trends and breakout points. Trend lines help determine whether the market is in an uptrend, which is essential for the bull flag to be valid. Support and resistance levels play a key role in identifying breakout zones, while the zigzag indicator can help filter out noise and highlight the flag structure more clearly.
Volume analysis is another critical factor in confirming a bull flag breakout. Additionally, candlestick patterns such as bullish engulfing candles can further validate a breakout entry.
Another useful tool is the Fibonacci retracement, which helps pinpoint ideal entry levels and profit targets. By combining these tools, traders can increase their accuracy and avoid false signals.
Backtesting Your Strategy for Better Performance
Testing the bull flag across multiple markets and time frames helps identify where it works best. Some strategies perform well on 1-hour or 4-hour charts in Forex but may be more effective on the daily chart in indices. Backtesting provides insights into win rates, drawdowns, and profitability, allowing for data-driven decision-making.
Risk Management
Since prop firms impose 5% daily and 10% overall drawdown limits, proper risk management is essential. Limit risk per trade to 0.25%–0.5% of account balance, set logical stop losses, and diversify trades across Forex, indices, stock market and crypto to reduce correlation risk. Maintaining a 1:2 or 1:3 risk-reward ratio ensures profits outweigh losses over time.
Use Top One Trader’s position size calculator to determine the ideal risk level for each trade. Take control of your risk management and trade smarter today!
Emotional Control
Discipline and patience are vital to long-term success. Fear and greed can cloud judgment, leading to impulsive decisions that go against your plan.
You can avoid letting emotions dictate your actions by building a structured trading plan with clear rules for entries, exits, and risk management. Staying patient and sticking to your strategy, even during periods of drawdown, is what separates successful traders from those who give in to emotional impulses.
It’s also important to accept losses as part of the game. Every strategy will have losing trades—what matters is identifying how much you’re willing to lose per trade and managing that risk consistently. If you’ve back-tested your strategy and found that it gives you an edge in the market, there’s no reason to worry about the occasional loss. Just stick to your plan and give your strategy time to play out—over time, the edge will work in your favor.

Conclusion
The bull flag chart pattern is a powerful strategy for prop firm traders due to its clear structure, which makes it easier to identify precise entry and exit points while managing risk effectively.
By combining tools like trend lines, support and resistance, and volume analysis, traders can confidently pinpoint breakout points and confirm the pattern’s validity. Trading flag patterns requires backtesting across different markets and timeframes, allowing traders to refine the strategy and tailor it to specific conditions.
With strong risk management, including stop losses and favorable risk-reward ratios, this strategy can help traders remain consistent and profitable, increasing their chances of passing prop firm challenges and achieving long-term success.
Take your trading to the next level with Top One Trader. The platform supports various strategies and provides educational resources to help you build and refine your own strategy. Start trading today and gain access to the tools and support needed for success!
Top Forex Trading Patterns To Pass Prop Firm Challenges
Prop firm challenges have become one of the most popular opportunities for traders looking to access significant capital.
However, passing these challenges isn’t just about luck—it requires a deep understanding of technical analysis, risk management, and a disciplined mindset. Many traders struggle with consistency because they fail to recognize high-probability setups and make good trades. This is where chart patterns play a crucial role in predicting price movements.
Mastering chart patterns provides traders with a structured approach to evaluating trends, identifying entry points, and spotting high-quality setups. When combined with a strict risk management plan and the right mindset, they give traders an edge, allowing them to make informed decisions rather than relying on guesswork.
In this guide, we will break down the most important forex trading patterns that can help you identify high-probability setups and become a funded trader. By the end, you’ll have a clear understanding of how to use these patterns effectively to maximize profits while minimizing risk.
Understanding Forex Trading Patterns
Forex trading patterns are visual representations of price movement that indicate potential market direction. These formations develop over time and provide traders with insights into whether the market will likely reverse, continue trending, or consolidate before a breakout.
Patterns play an important role in technical analysis by helping traders anticipate movements rather than react to them. Recognizing these formations on charts allows traders to set precise entry and exit points, reducing the risk of poor trade execution.
Key Aspects of Trading Patterns
- Trend Identification – Align patterns with the market trend (uptrend, downtrend, or reversal).
- Structure & Formation – Recognize pattern shapes early for better trade setups.
- Price Action – Analyze candlestick behavior, wicks, type and size of the candle, and momentum to confirm patterns.
- Volume Confirmation – Strong price movement needs high volume; weak volume may signal false moves.
- Support & Resistance – Patterns often form around key levels, helping determine entries/exits.
- Breakout & Retest – A retest after a breakout strengthens confirmation and reduces false signals.
- Timeframe Consideration – Higher time frames provide stronger signals, while lower ones offer frequent setups.
- Risk Management – Use stop-loss, take-profit, and proper risk-reward ratios for consistency.
Reversal Chart Patterns
Reversal patterns signal a potential change in the current trend, whether it’s a shift from an uptrend to a downtrend or vice versa. These formations indicate that market sentiment is shifting, and traders should prepare for a potential trend reversal.
Double Top & Double Bottom
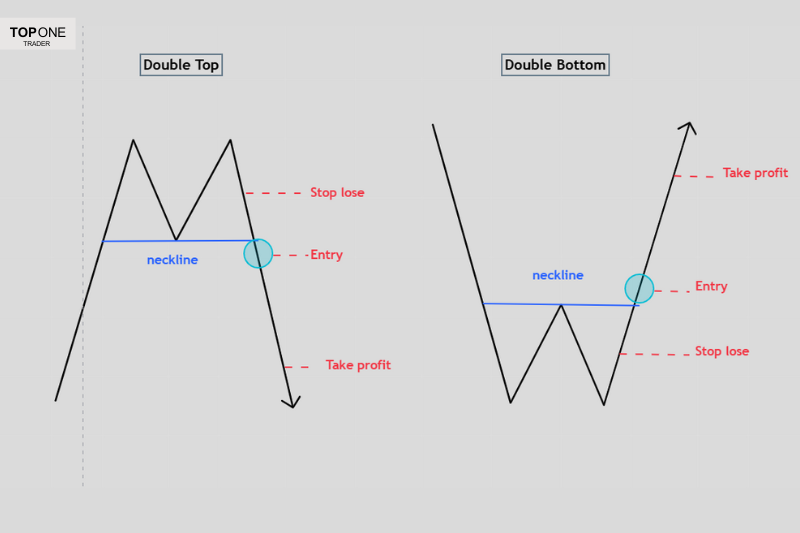
- Double Top: A bearish reversal pattern that forms after an uptrend. The price reaches a resistance level twice before reversing downward, signaling that buyers are losing control.
- Double Bottom: A bullish reversal pattern that occurs after a downtrend. Price tests a key support level twice before bouncing higher, indicating strong buying pressure.
Head and Shoulders & Inverse Head and Shoulders
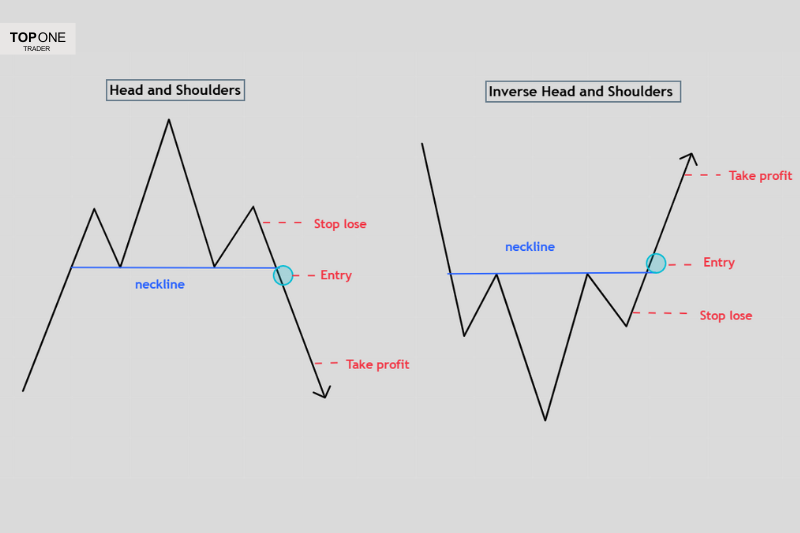
- Head and Shoulders: A bearish reversal pattern that forms after an uptrend. It consists of three peaks, with the middle peak (head) being the highest. A break below the neckline confirms the downtrend.
- Inverse Head and Shoulders: A bullish reversal pattern that forms after a downtrend. It mirrors the standard head and shoulders but signals a shift to an uptrend upon breaking the neckline.
Becoming a funded trader is an exciting opportunity, but having the right skills is essential! Top One Trader provides you with the necessary tools and real capital in a supportive environment, giving you the chance to take advantage of opportunities without risking your own funds.
Rising Wedge & Falling Wedge chart patterns
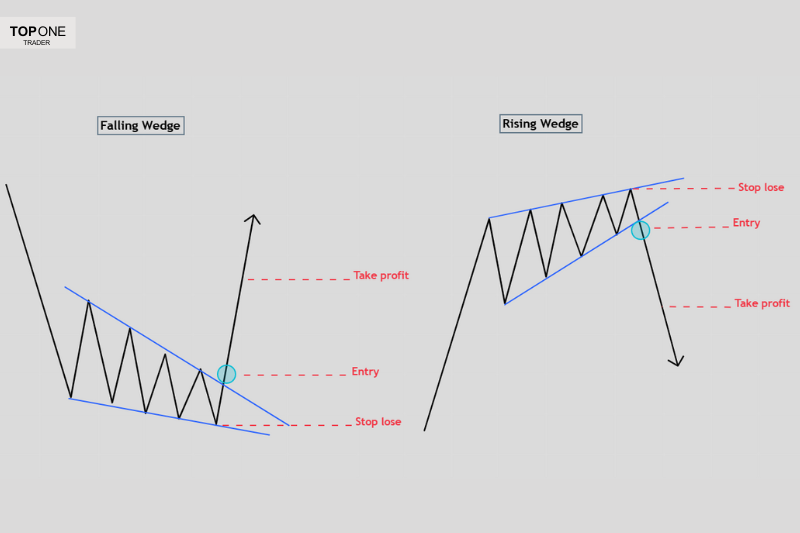
- Rising Wedge: A bearish pattern that forms when price consolidates within upward-sloping support and resistance lines. The support line is steeper than the resistance, indicating a loss of bullish momentum. When price breaks below the wedge, a downtrend usually follows.
- Falling Wedge: A bullish pattern where price consolidates downward but in a way that suggests a reversal is coming. The resistance line is steeper than the support line, and a breakout to the upside signals the beginning of a bullish trend.
Continuation Chart Patterns
Continuation patterns indicate that the current trend is likely to persist after a brief consolidation phase. These formations provide traders with opportunities to enter trades in the direction of the prevailing trend with confidence.
Falling Wedge & Rising Wedge chart patterns
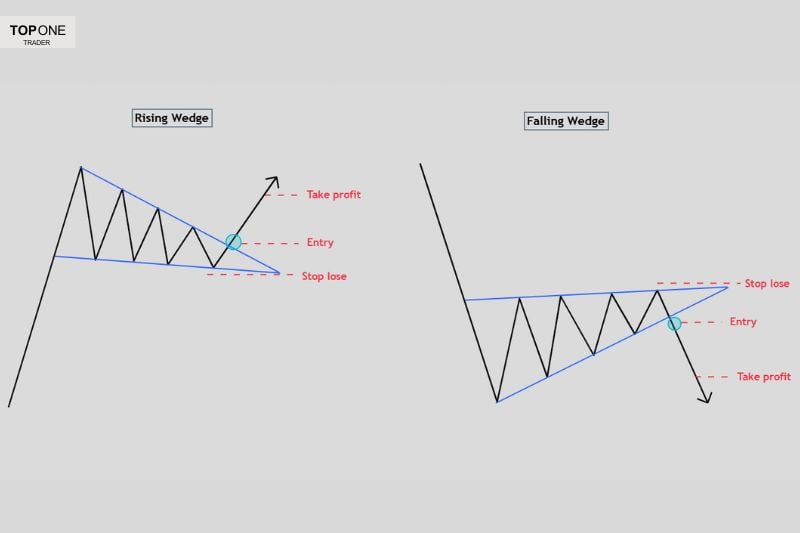
While wedges can act as reversal patterns, they can also serve as continuation signals.
- Falling Wedge as a Continuation: When this pattern appears in an uptrend, it often signals that the price is merely pausing before continuing higher.
- Rising Wedge as a Continuation: In a downtrend, a rising wedge indicates that the market is consolidating before continuing its move downward.
Bullish & Bearish Rectangles

- Bullish Rectangle: A consolidation phase where price moves sideways within a range before breaking higher. Traders look for a breakout above resistance to confirm bullish momentum.
- Bearish Rectangle: Similar to the bullish rectangle but in a downtrend. Price consolidates within a range before breaking lower, confirming further bearish movement.
Bullish & Bearish Pennants
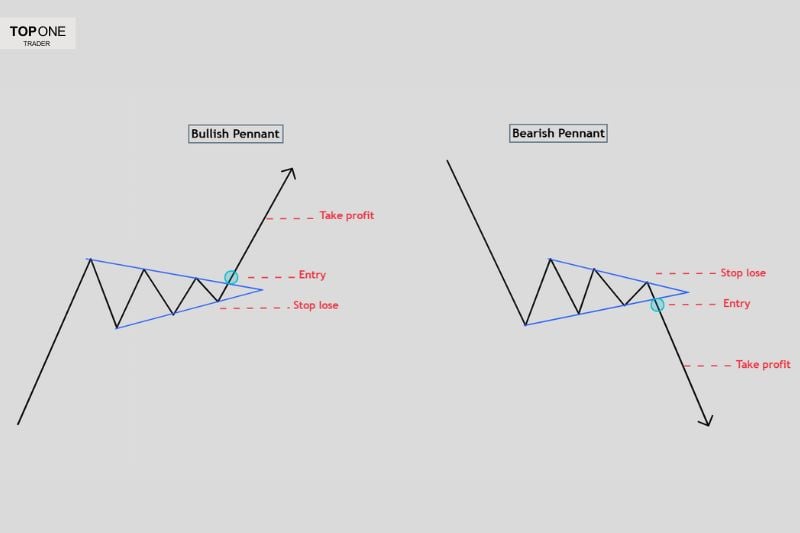
- Bullish Pennant: Forms after a strong uptrend where price consolidates in a small triangular formation before breaking out higher.
- Bearish Pennant: Appears after a strong downtrend, with price forming a small consolidation phase before breaking lower.
By understanding and effectively using reversal and continuation patterns, traders can develop a structured approach to passing prop firm challenges. The next section will cover bilateral patterns and the role of supply and demand zones in market movements. Mastering these concepts will further refine your trading strategy and increase the likelihood of passing prop firm evaluations successfully
Bilateral Chart Patterns (Breakout in Either Direction)
Bilateral chart patterns indicate that the market is consolidating and could break out in either direction. These formations are crucial in forex trading, as they highlight indecision before a strong price movement. Traders must be ready to react when the breakout occurs, using price action confirmation.
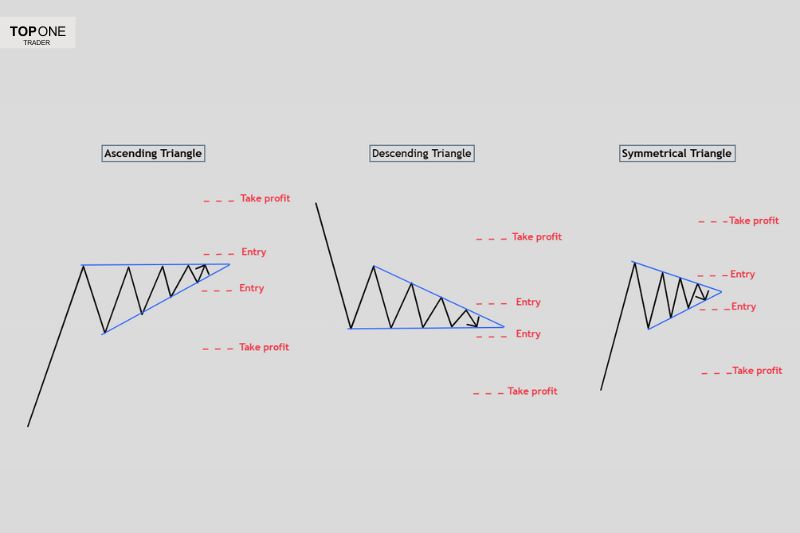
Ascending Triangle
The ascending triangle is a bullish pattern formed when the price makes higher lows while resistance remains at a fixed level. This suggests growing buying pressure, and a breakout to the upside is often expected. However, in some cases, the price may break downward, making it essential to confirm the breakout direction before entering a trade.
Descending Triangle
In contrast, the descending triangle is a bearish pattern where the price forms lower highs while support stays fixed. This indicates increasing selling pressure. A breakdown below the support level typically signals further downside movement, but if buyers regain control, an upward breakout could occur.
Symmetrical Triangle
The symmetrical triangle is a neutral pattern that forms when both the support and resistance lines slope toward each other, creating a ranging price movement. This pattern reflects market indecision, meaning the breakout could happen in either direction. Traders watch for volume and momentum to confirm which side the price will break toward.
Supply and Demand
Supply and demand zones are fundamental in forex trading, helping traders identify areas where price is likely to make significant movements. Unlike wedge patterns, supply and demand zones require a deeper retracement into areas where buying or selling pressure is concentrated, making them crucial for determining entry and exit points.
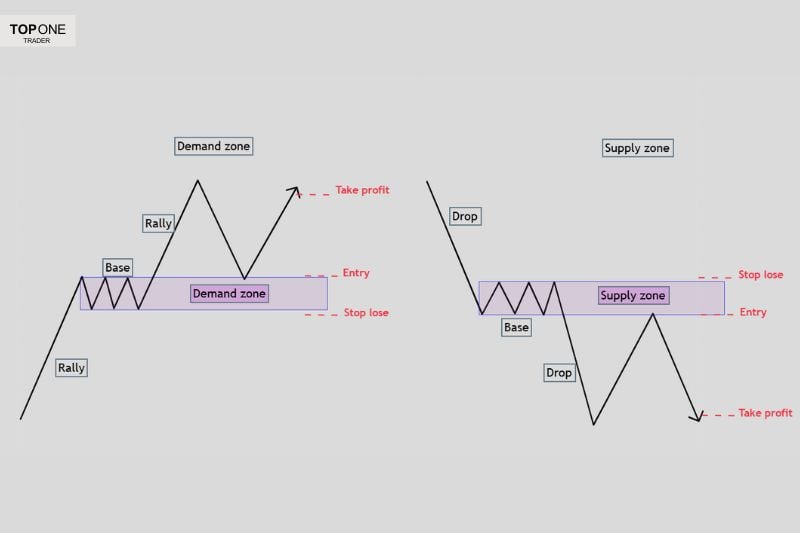
Demand Zones – Identifying Strong Buying Areas
A demand zone is an area where the price has historically bounced upward due to strong buying interest. These zones are formed when institutional traders place significant buy orders, causing the price to rally. When price returns to a demand zone, traders look for confirmation signals, such as bullish candlestick formations or trend line support, before entering long positions.
Supply Zones – Recognizing Where Sellers Take Control
A supply zone is the opposite of a demand zone, representing areas where selling pressure has historically driven the price downward. These zones are formed when institutional traders place large sell orders. When price retests a supply zone, traders look for bearish confirmation, such as a false break above resistance or bearish candlestick patterns, to take short positions.
Key Focus: Price Action Validation
To avoid unnecessary losses, traders must validate supply and demand zones using price action signals. Factors such as volume spikes, candlestick confirmations, and Multi-Time frame analysis help increase the accuracy of trades taken from these levels.
How to Use These Patterns to Pass a Prop Firm Challenge
Passing a prop firm challenge requires a combination of trading strategy, risk management plan and emotional control. Here’s how traders can apply these chart patterns effectively:
1. Choosing the Right Timeframe for Trading
Understanding the importance of multiple time frame analysis is essential for making informed trading decisions. Higher time frames, such as daily charts and 4-Hour, provide a broader view of the market trend. These time frames are better for identifying key patterns and trend direction because they reduce noise and false signals. Patterns that form on higher time frames are typically more reliable, resulting in higher-quality setups and a higher win rate.
On the other hand, lower time frames (such as 1-Hour or 15-Minute) help refine entry points with more precision. When a pattern is observed on a higher time frame, it holds more weight and is considered a stronger signal, increasing the likelihood of successful trades.
By combining both higher and lower time frames, traders can enhance their analysis and improve their chances of executing profitable trades.
2. Using Trend Lines & Key Levels to Confirm Pattern Validity
A rising wedge, for example, should show clear resistance and support slopes converging. Similarly, key levels such as support and resistance zones, psychological price points, and Fibonacci retracement levels help validate whether a pattern is forming correctly.
3. Avoiding False Breaks
False breaks occur when the price temporarily moves beyond a pattern’s boundary but then reverses direction. To avoid falling into traps, traders must wait for confirmation signals like a strong close beyond a breakout level, volume confirmation, or retests of the broken level before entering a trade.
4. Using Risk Management to Avoid Unnecessary Drawdowns
Risk management is key in any trading strategy, but it’s especially critical in prop firm challenges where strict drawdown limits apply. Here are essential risk management techniques:
- Proper Position Sizing: Never risk more than 0.25-0.5% of the prop firm account balance per trade.
- Use Stop Losses: Set stop losses based on price volatility and important levels, not random points.
- Take Profits at Key Levels: Partial take profits at major support/resistance help secure gains while letting the trade run.
- Maintain a Good Risk-Reward Ratio: A minimum of 1:2 or 1:3 ensures that wins outweigh losses over time.

Conclusion
Mastering forex trading patterns is essential for passing a prop firm challenge successfully. Reversal patterns like the double top and head and shoulders indicate potential trend shifts, while continuation patterns such as wedges and pennants help traders ride existing trends.
Bilateral patterns like triangles signal potential breakouts in either direction, requiring traders to be prepared for both scenarios. Additionally, understanding supply and demand zones provides an extra layer of confluence when analyzing market movements.
By combining price action analysis, key levels, and proper risk management, traders can significantly improve their accuracy and success rate in prop firm challenges.
However, passing a challenge isn’t just about recognizing patterns—it’s about executing trades with discipline and confidence. Backtesting these patterns and refining strategies before taking the evaluation can make all the difference in achieving consistent profitability.Take your forex trading to the next level with Top One Trader. The platform supports various strategies and provides educational resources to help you build and refine your own strategy. Start trading today and gain access to the tools and support needed for success!
Forex Trading Strategies Explained
The foreign exchange market, commonly known as Forex, is the world’s largest and most liquid financial market, with a daily trading volume exceeding $7 trillion.
Unlike stock markets that operate within specific hours, Forex runs 24/5, allowing traders across different time zones to trade currencies in a decentralized environment. This global market plays an essential role in international trade, investments, and economic stability, making it a necessary pillar of the financial markets.
Forex presents an opportunity to generate significant profits, but it’s also a market where traders can lose money rapidly if they lack a clear plan. A well-defined strategy helps traders navigate the market, minimize emotional decision-making, and optimize their trading performance over time.
However, no single strategy fits all traders. The Forex market is dynamic, meaning different strategies work under different market conditions.
A successful Forex trader understands that their approach should align with their risk tolerance, trading style, and financial goals. Whether one prefers swing trading, day trading, or scalping, the key to long-term success lies in applying a Forex trading strategy based on sound analysis, discipline, and continuous adaptation to market trends.
Understanding Forex Trading Strategies
To master trading Forex, one must first understand the different trading styles and how they shape the strategies traders use. Let’s explore the main types of traders and their preferred approaches.
Types of Traders Based on Trading Strategy
In the Forex market, traders adopt different strategies depending on their time commitment, risk tolerance, and market approach. Here are the key trading strategies and how they align with different trading styles:
1. Technical analysis trading
Technical traders rely on price action, charts, and indicators to make trading decisions. They analyze patterns, trends, support and resistance levels, and use various tools to predict price movements.
Some of the most common strategies include:
| Trend lines | Traders follow the overall market direction (uptrend or downtrend) and enter trades in line with the prevailing trend. Moving averages and trendlines are commonly used for confirmation. |
| Support & Resistance | This strategy identifies key price levels where the market historically reverses or consolidates. Traders look for breakouts or bounces at these levels to enter trades. |
| Pivot Points | Based on previous price action, pivot points help traders identify potential support and resistance zones for intraday trading. |
| Chart Patterns | Patterns like head and shoulders, double tops/bottoms, and triangles help traders predict potential market reversals or continuations. |
| Elliott Wave Theory | This advanced strategy interprets market cycles based on investor psychology, identifying waves that suggest future price movements. |
| Dow Theory | A foundational principle in technical analysis that describes market trends through different phases (accumulation, markup, and distribution), helping traders understand the overall market structure. |
| Price action and breakout trading | Breakout traders enter trades when the price moves to break key support or resistance levels, anticipating strong momentum in the breakout direction.Price action traders, on the other hand, rely on a price action strategy, using candlestick patterns like pin bars and engulfing candles. They focus purely on price movements, without using indicators, for faster and more precise decision-making. |
2. Fundamental analysis trading
These traders focus on economic indicators, interest rates, central bank policies, and global events that impact currency values. They analyze GDP reports, employment data, inflation, and political developments to anticipate long-term market movements. Many traders using this strategy hold positions for extended periods, aligning their trades with macroeconomic trends.
3. Sentiment analysis trading
Sentiment traders analyze market mood and trader positioning using tools like Commitment of Traders (COT) reports, Fear & Greed Index, and retail sentiment indicators. By assessing whether the market is bullish or bearish, they align their trades with or against the prevailing sentiment to gain an edge.

4. Algorithmic trading
These traders use automated systems, bots, or AI-driven strategies to execute trades based on predefined criteria. Their approach minimizes emotional decision-making and improves execution speed, making it ideal for high-frequency trading, scalping, and market-making strategies.
5. News trading
News traders capitalize on market volatility caused by economic releases, central bank decisions, and geopolitical events. They react to major announcements like Non-Farm Payrolls (NFP), CPI reports, and interest rate decisions to capture rapid price movements in the market.
Each trading strategy offers unique advantages, and the best approach depends on a trader’s experience, time availability, and risk appetite.
Stay ahead of the market with Top One Trader’s Economic Calendar. Track key economic events and news releases to make informed trading decisions. Stay prepared and trade with confidence today!
Building And Exploring Advanced Forex Trading Strategies
Building an effective trading strategy isn’t about blindly following signals or copying other traders. It’s about developing a structured approach that fits personal trading preferences and adapts to changing market conditions. Here are the essential steps to crafting a winning strategy:
- Define Your Trading Goals – Are you aiming for steady growth, high-risk speculative gains, or passive income? Your objectives will shape your strategy.
- Choose Your Trading Style – Based on your time commitment, risk tolerance, and financial targets, choose between scalping, day trading, swing trading, or position trading.
- Select Your Market Approach – Decide whether you’ll rely on technical analysis, fundamental analysis, or other approach.
- Select the Markets You Want to Trade – In the Forex market, there are numerous currency pairs, each influenced by different economic factors. Choose the pairs that align with your strategy and understanding of market dynamics.
- Select the Time Frames You Will Use – If you are a scalper, you’ll likely focus on 1-minute or 5-minute charts. Day traders commonly use 15-minute to 1-hour charts, while swing traders rely on 4-hour and daily time frames.
- Develop Entry and Exit Rules – Use tools like trend lines, Fibonacci retracement, breakout strategies, and price action patterns to define clear entry and exit points.
- Implement a Risk Management Plan – Determine the number of trades you will take and the level of risk per trade, per day, or per week. Set stop-losses to protect your capital and ensure long-term profitability.
- Backtest Your Strategy – Before committing real money, test your strategy on a demo account with multiple currency pairs. Collect and analyze data to refine your approach and build confidence in your system.

The Tools Behind Every Successful Trading Strategy
A well-built Forex trading strategy relies on several tools and techniques:
| Charting and Technical Analysis Tools | TradingView: Offers advanced charting with indicators like Fibonacci retracements, RSI, Moving Averages, and MACD to identify trends and reversal points. |
| Market Data and News Tools | Forex Factory & Myfxbook: Track economic calendars and community insights.Financial Juice & Investing.com: Provides real-time news and sentiment tracking for market analysis. |
| Risk Management and Position Sizing Tools | MyFXBook Position Size Calculator: Helps determine proper trade size based on risk tolerance, ensuring trades align with your risk management plan. |
| Backtesting and Strategy Development Tools | Forex Tester & TradingView Replay Mode: Test strategies on historical data.Python & R: Used for backtesting and developing algorithmic trading strategies. |
| Trade Management Tools | Prop Firm Dashboards like Top One Trader: Manage funded accounts and track progress while adhering to risk parameters. |
| Sentiment and Order Flow Analysis Tools | COT Report: Analyzes institutional positioning to gauge market sentiment.DOM & Footprint Charts: Monitor order flow and liquidity for precise trade entries. |
| Automated Trading and AI Tools | MetaTrader EAs & Pine Script: Automate trading based on predefined rules or custom strategies. |
These tools help streamline your trading, improve accuracy, and maintain discipline in risk management.
Use Top One Trader’s position size calculator to determine the ideal risk level for each trade. Take control of your risk management and trade smarter today!
The Importance of Backtesting
One of the most overlooked aspects of developing a Forex trading strategy is backtesting. This process involves testing a strategy using historical data to determine how it would have performed in past market conditions. Traders can identify strengths, weaknesses, and areas for improvement before risking real capital. A good backtesting routine includes:
- Running simulations over different timeframes and trading sessions.
- Testing the strategy under various market conditions (trending, ranging, high volatility) through demo accounts.
- Tracking key performance metrics like win rate, drawdowns, and profit percent.
Backtesting helps traders refine their strategies and gain confidence in their trading plan, ultimately leading to better decision-making in live markets.

What Makes a Trader Successful?
Success in forex trading doesn’t happen by chance. It’s a combination of having strategies that provide an edge in the market, developing a solid risk management plan, and cultivating the right mindset. Let’s break down what each of these components involves:
Strategies with an Edge
A trader’s strategy needs to have an edge in the market, meaning that it gives them an advantage over others in terms of predicting price movements. Building your own strategy is essential, as it allows you to adapt it to market conditions and personal preferences.
A good strategy combines both technical and fundamental analysis, depending on the trader’s style. The key is consistency and testing the strategy with backtesting tools to ensure it’s effective over time.
Risk Management Plan
One of the most critical aspects of successful trading is having a comprehensive risk management plan. Regardless of how good a trader’s strategy is, they must have a plan in place to protect their capital.
Here are some risk management principles to follow:
- Risk per Trade: Successful traders never risk more than 1% of their total capital on a single trade. This ensures that a series of losses won’t wipe out their account.
- Position Sizing: Proper position sizing helps determine how many lots to trade based on your risk tolerance and stop-loss level.
- Stop-Loss Orders: Using stop-losses is one of the best ways to manage risk. A well-placed stop-loss order prevents emotional trading and ensures that a loss doesn’t turn into a larger one.
- Diversification: Trading multiple currency pairs or asset classes can help spread risk across various trades.
The Right Mindset
The mindset of a trader is often the most significant factor in achieving success. Trading psychology plays a vital role in how traders handle wins and losses. Successful traders maintain a calm and disciplined mindset, avoiding emotional decisions that could lead to impulsive trades.
Here’s what the right mindset looks like:
- Patience: A trader must be patient and wait for the right opportunities to arise. Rushing into trades can lead to unnecessary losses.
- Discipline: Sticking to your trading plan, avoiding emotional decisions, and executing trades with consistency are all signs of a disciplined trader.
- Adaptability: The forex market is constantly changing, so a successful trader must be flexible and adjust their strategy when necessary. Adapting to new conditions while staying true to your overall plan ensures long-term success.

Conclusion
Developing a strong trading strategy is essential for long-term success in trading forex. It requires a clear market edge by combining technical and fundamental analysis. A solid risk management plan, including smart position sizing and stop-loss orders, helps protect capital and minimize losses. Equally important is maintaining a disciplined and adaptable mindset.
Success in forex trading isn’t just about having a good strategy—it’s about continuously improving it, learning from mistakes, and adapting to market changes. Traders who stay committed to refining their approach increase their chances of achieving consistent profitability.
Take your forex trading to the next level with Top One Trader. The platform supports various strategies and provides educational resources to help you build and refine your own strategy. Start trading today and gain access to the tools and support needed for success!
Best TradingView Alternatives for Charting & Trading
TradingView is one of the most popular trading and charting platforms used by traders worldwide. It offers a wide range of features, such as:
- advanced charting tools for technical or fundamental analysis,
- real-time market data, and
- a large trading community.
While TradingView provides an impressive suite of features, some traders find its premium plans too expensive, while others need deeper customization, broker integrations, or specialized tools that TradingView lacks.
For those who rely on advanced backtesting, automated trading, or niche trading strategies, exploring alternatives can open up new opportunities.
In this article, we’ll break down the best TradingView alternatives—platforms that deliver cutting-edge technical analysis, automation, and real-time market insights to help traders of all levels refine their strategies and improve performance.
Where to Trade Beyond TradingView
Whether you need advanced charting, seamless broker integration, or automation tools, there are several platforms that can match—or even surpass—TradingView in key areas. Below, we explore some of the most powerful alternatives, each offering unique advantages to fit different trading styles.
1.1 TradeLocker
Key Features:
User-Friendly Interface with Advanced Charting Tools: TradeLocker features a user-friendly interface that caters to both beginners and experienced traders. Its advanced charting tools provide in-depth price action analysis, time frames, and technical indicators.
Streamline trading with one-click order execution and an SL & TP calculator that automatically calculates Stop Loss and Take Profit values in $, %, and lot ratios.
Real-Time Data and In Depth Analysis Tools: One of the standout features of TradeLocker is its provision of real-time data to analyze market trends. Traders can access up-to-the-minute pricing and technical analysis tools, enabling them to make well-informed, timely trading decisions.
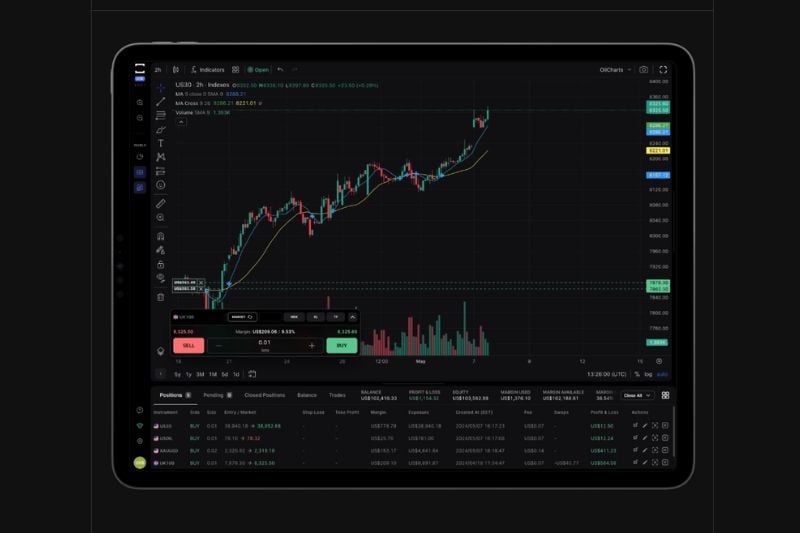
tradelocker.com
Integration with Multiple Brokers and prop firms: TradeLocker seamlessly integrates with multiple brokers and prop firms, allowing traders to execute trades directly from the platform. This eliminates the need to switch platforms and ensures consistent asset pricing, making trading more efficient.
Automated Trading Features: With TradeLocker, traders can set automated trading strategies based on their pre-defined criteria. This means that they can automate their trading without constantly monitoring the markets, which is especially useful during off-hours or volatile market conditions.
Best for:
Day traders and scalpers who require quick access to real-time data, technical analysis, and the ability to trade directly from the platform. The integration of multiple brokers makes it especially beneficial for traders managing multiple trading accounts. Additionally, its automated trading capabilities help minimize emotional trading.
1.2 Match-Trader
Key Features:
Customizable Trading Environment with Advanced Charting Tools: Match-Trader allows users to completely customize their dashboard, charting tools, and layout. This feature provides traders with the flexibility to set up the platform to suit their specific needs, whether they prefer complex chart setups or simpler, more straightforward views.
Web-Based Platform with Mobile-Friendly Access: Match-Trader is web-based, meaning you can access the platform from any device that has an internet connection. The platform is also mobile-friendly, so you can track markets and execute trades on your phone or tablet, making it a convenient option for traders who need to be mobile.
Supports Both Manual and Automated Trading: Whether you prefer a hands-on approach with manual trading or the convenience of automated trading, Match-Trader supports both. This flexibility allows traders to switch between methods based on personal preferences.
Real-Time Market Data: Match-Trader provides in-depth market analysis tools and real-time market data. This allows traders to stay on top of price movements, identify new opportunities, and refine their strategies.
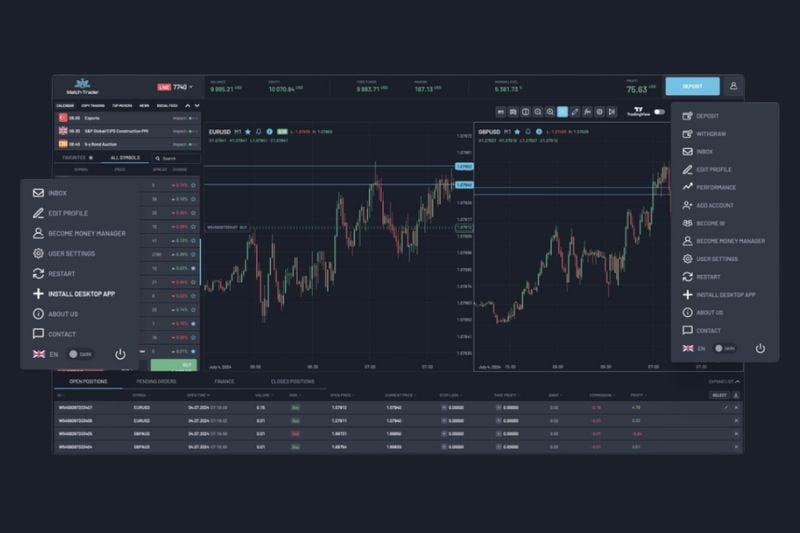
match-trader.com
Best for:
Traders who are looking for a modern, intuitive, and customizable trading experience. The web-based nature and mobile access make it suitable for traders who are always on the move and prefer flexibility in managing their trades.
1.3 Forex Tester Online
Key Features:
Historical Data and Backtesting Capabilities for Strategy Testing: Forex Tester Online focuses heavily on backtesting, an essential tool for traders refining their strategies before using real capital.
It provides manual backtesting and forward testing, allowing users to test strategies with over 24 years of accurate historical data, reflecting real market conditions.
One of the key benefits of Forex Tester Online is its ability to simulate key market movements without the financial risk. Traders can practice their strategies in a safe, risk-free environment and gain confidence before applying them in real-time market conditions.
Additionally, users can create Expert Advisors (EAs) and algo-trading strategies, automating their approach for greater efficiency and precision
Supports Technical, fundamental and risk management tools: Like other advanced platforms, Forex Tester Online offers a wide range of technical analysis tools, including indicators like moving averages, RSI, and Fibonacci retracements, and also provides news updates and risk management tools like position size calculator and risk to reward tool.
The platform also offers various chart types to support different analysis styles, from basic line charts to candlestick charts.
Use Top One Trader’s position size calculator to determine the ideal risk level for each trade. Take control of your risk management and trade smarter today!
forextester.com
Best for:
Anyone who prefers to test strategies before executing them in live markets. If you’re developing a new trading strategy, refining your current one, or working on algo-trading systems, Forex Tester Online offers a secure, risk-free environment to do so
It’s perfect for traders who want to backtest over large periods and ensure their strategy holds up in various market conditions, including algorithmic trading strategies.
2. Other Powerful Alternatives to TradingView
In addition to proprietary platforms like TradeLocker and Match-Trader, there are several well-established platforms that provide excellent charting, analysis, and trading capabilities.
These alternatives offer a range of tools for traders across different markets like forex, stocks, and futures. Below are some noteworthy alternatives to consider:
2.1 MetaTrader 4 & MetaTrader 5 (MT4/MT5)
MetaTrader 4 (MT4) and MetaTrader 5 (MT5) are among the most popular platforms for forex and CFD trading, widely used in the trading community.
While they cater primarily to forex traders, they also support a variety of asset classes like CFDs, indices, and commodities. Both platforms offer advanced tools for technical analysis, trading automation, and real-time news feeds, making them well-suited for experienced traders.
The key features of MT4 and MT5 include a comprehensive set of technical analysis tools, such as indicators like Moving Averages, RSI, MACD, and Fibonacci retracements, along with customizable chart styles and drawing tools.
Additionally, both platforms support automated trading through Expert Advisors (EAs), allowing traders to set automatic buy/sell signals and execute trades, which is ideal for algorithmic traders or those who prefer a more passive approach. The platforms also provide real-time news, ensuring traders stay informed of market events.
Best for:
Traders who want to develop and optimize automated trading strategies. MT4 and MT5 provide a robust environment for algorithmic trading, enabling traders to build custom trading bots using MQL4 and MQL5 programming languages.
2.2 ThinkorSwim (by TD Ameritrade)
ThinkorSwim is a powerful trading platform from TD Ameritrade, known for its advanced technical analysis tools and user-friendly interface. It is especially popular among U.S.-based traders due to its wide range of supported assets and seamless integration with TD Ameritrade’s brokerage services.
The platform provides comprehensive market data and sophisticated charting features, making it ideal for traders seeking detailed analysis and real-time information.
Key features of ThinkorSwim include live market data, advanced charting, and customizable indicators, along with multi-chart layouts and drawing tools. The platform also offers extensive educational resources, such as video tutorials, webinars, and articles, which make it a great choice for traders who want to learn while trading.
Supporting stocks, forex, futures, and options trading, ThinkorSwim is versatile and allows users to diversify their portfolios.
Best for:
U.S. traders looking for an all-in-one platform that offers detailed market analysis tools, educational content, and support for various asset classes.

2.3 NinjaTrader
NinjaTrader is a popular platform, particularly among futures and forex traders, and is known for its professional-grade charting tools and backtesting capabilities. It is favored by traders who require precision and accuracy in developing their strategies. NinjaTrader is ideal for those looking to fine-tune their trading plans with advanced tools for market analysis and strategy testing.
Key features of NinjaTrader include advanced charting and backtesting tools, allowing traders to simulate strategies with historical data and optimize their future trades. The platform supports brokerage integration, making it easy to execute strategies directly from the same platform.
Traders can also create custom indicators and set up automated trading strategies to manage trades on their behalf.
Best for:
Futures and forex traders who require advanced charting tools, backtesting capabilities, and brokerage integration. It is especially suitable for scalpers who need accurate data and micro timeframes, such as 5s, 15s, or 1-minute charts.
2.4 Trading Station (by Forex.com)
Trading Station by Forex.com is a robust platform specifically designed for forex traders, offering comprehensive charting and analysis tools. Its seamless integration with Forex.com’s brokerage services makes it an excellent choice for traders who prefer a platform tailored for currency trading.
Key features of Trading Station include advanced charting, technical analysis tools, and a variety of order types, all optimized for forex trading. The platform also offers high-quality tick data, ensuring precise price tracking and reliable execution, which is essential for precision trading in fast-moving markets.
Additionally, Trading Station allows traders to use custom technical indicators and automate their strategies, providing flexibility for those looking to streamline their trading process.
Best for:
Forex traders needing high-quality market data, advanced charting, and precise real-time pricing. Ideal for algorithmic traders and those who use high-frequency trading (HFT), as they rely on accurate market prices to execute trades with small targets, ensuring minimal slippage and optimal order execution.

Choosing the Best TradingView Alternative
Selecting the right alternative to TradingView depends on your specific trading needs. Here are some key considerations to help you make the right choice:
Advanced Charting Tools: One common feature across most platforms is advanced charting tools. Unless you need something very specific, you can generally use any of these platforms for analysis purposes. They all offer the essential charting tools, indicators, and chart customization you need to analyze the markets.
Backtesting Your Strategy: If backtesting is a priority for you, Forex Tester is an excellent platform tailored to this need. It offers detailed historical data and tools to simulate your strategies.
Integration with Multiple Brokers and Prop Firms, or Automation of Strategies: If you require seamless integration with brokers and prop firms or want to automate your strategies, TradeLocker is the way to go. It allows easy connection with various platforms and provides tools for algorithmic trading.
Trading Multiple Asset Types: If you’re looking to trade a wide range of asset types, such as stocks, forex, crypto, and indices, or if you’re interested in algorithmic trading, MetaTrader 4 & MetaTrader 5 can support all your needs. They offer robust features, extensive customization options, and support for both manual and automated trading.

Conclusion
TradingView is a powerful platform with advanced features, but it’s not the only trading tool out there. If you need automation and broker flexibility, TradeLocker and Match-Trader are strong choices. For backtesting, Forex Tester Online offers extensive historical data. Traders seeking all-in-one solutions can explore MetaTrader 4 & 5, ThinkorSwim, or NinjaTrader for advanced analysis and execution.
The right platform depends on your needs—whether it’s automation, backtesting, or multi-asset trading. Explore these alternatives to find the best fit for your strategy and trading style.
Ready to take your trading career to the next level? Sign up with Top One Trader, which supports both Trade Locker and Match Trader, and use the best and latest technology to trade. Start your journey today with the right support and tools!