
What is PnL in Trading?
In trading, every decision comes with a cost or a reward. That’s where PnL, short for Profit and Loss, comes into play. It’s the most fundamental metric used by traders from all levels to measure trading performance over a specific period or set of trades.
At its core, PnL refers to how much you’ve gained or lost, expressed either in dollar terms or as a percentage of your capital. It reflects your ability to manage risk, capitalize on opportunities, and maintain consistency traits that are especially important when trading under evaluation rules set by proprietary firms.
Why Tracking Profits and Losses Matters
If you’re not tracking your trades, you’re not really trading; you’re gambling. A consistent review of profit and loss isn’t just about knowing whether you’re up or down; it helps you identify what works, what doesn’t, what the maximum drawdown is, and where your strategy needs improvement.
For prop traders, PnL is a key metric used not only to measure performance but to assess your suitability for funded capital. Most firms expect traders to maintain a positive PnL ratio, follow risk parameters, and show consistent results. Your ability to track and interpret your PnL can make or break your trading career.
Realized vs. Unrealized PnL: Understanding Open and Closed Positions
When reviewing a trader’s performance, it’s essential to understand the distinction between realized and unrealized PnL. Both play different roles in strategy evaluation and capital allocation.
What is Realized PnL?
Realized PnL is the actual profit or loss that becomes final after a trade is closed. Once you exit a position, whether it’s a single trade or a group of trades, the result is considered “realized.” This value appears in your account balance and is used to assess your trading performance. It applies whether you’re in a prop firm evaluation, already funded, or trading a personal account.
Example of a closed position
Suppose you buy 1 standard lot of EUR/USD at 1.1000 and close the trade at 1.1050. The price has moved 50 pips in your favor. If you’re trading a standard lot, where 1 pip equals $10, your realized PnL would be:
50 pips × $10 = $500 profit
This $500 profit is added to your account balance after deducting any applicable fees, commissions, or slippage that may have occurred during the trade.
What is Unrealized PnL?
Unrealized PnL, also known as paper profit or loss, represents the potential gain or loss from an open position or a group of open positions. It is based on the difference between the entry price and the current market price, multiplied by the total position size. Since the trades are still open, the profit or loss is not locked in and can change at any moment with market movement.
Example of an open position
Suppose you go long 2 lots of gold (XAU/USD) at $3,250 per ounce, and the current market price has increased to $3,320. Each standard lot represents 100 ounces, giving you a total position size of 200 ounces.
To calculate PnL for open positions, simply multiply the difference between the current price and entry price by the total number of units:
($3,320 − $3,250) × 200 = $14,000 profit
This $14,000 is your unrealized profit. Since the position remains open, this amount is not guaranteed. If the price of gold moves lower, your profit could decrease, or even turn into a loss if it falls below your entry price.
Ready to Master Risk Management? Use the Top One Trader Position Size Calculator to plan your trades like a pro. Input your Instrument, stop loss, risk and account balance and let the calculator do the rest. Calculate Your Position Size Now
Equity vs. Balance: What’s the Difference?
In trading, especially with prop firms, it’s important to understand the difference between balance and equity.
Your balance shows the total value of your account based on closed trades only. It reflects your realized profit or loss and stays unchanged while trades are still open.
Equity, on the other hand, includes both your balance and the unrealized PnL from any open positions. It updates in real time as the market moves, giving you a live view of your account’s current value.
This difference matters when it comes to drawdown rules. Some prop firms calculate drawdown based only on your balance, while others use your equity, often at a specific time of da,y to determine if you’ve breached the limit.
This is especially common in daily drawdown models or trailing drawdown rules, where the lowest equity value within a trading day, or compared to peak equity, can trigger a violation. Even if your trade recovers later, the earlier dip may still count.
Understanding how your firm defines and monitors drawdown, whether through balance or equity, is crucial for managing risk and protecting your evaluation or funded account.
Types of PnL: Price-Based and Percentage-Based
Understanding the different ways to calculate and interpret PnL is essential for evaluating your trading performance and making informed decisions. PnL, or Profit and Loss, can be measured in two primary formats: price-based and percentage-based. Each format offers deeper insights into your risk exposure, trading consistency, and return potential.
Price-Based PnL (Monetary Terms)
This is the most direct way to express profit or loss: in actual currency units. It tells you how much money you made or lost on a trade.
Formula: PnL = (Exit Price − Entry Price) × Quantity − Fees
- Entry Price: The price at which you entered the position
- Exit Price: The price at which you closed it
- Quantity: Number of units (shares, lots, contracts, etc.)
- Fees: Commissions, slippage, spreads, and other costs
This method gives a clear dollar-based outcome and is used in most broker dashboards to show both realized and unrealized PnL for open and closed positions.
Example: You buy 10 shares at $50 and sell them at $55. Ignoring fees, your PnL is:
(55 – 50) × 10 = $50 profit
Price-based PnL is ideal for understanding total gains and losses in absolute terms, managing position size, and calculating risk on a trade-by-trade basis. It is also essential for real-time decision-making and monitoring the performance of open trades.
Percentage-Based PnL (Relative Terms)
Percentage-based PnL shows how much you earned or lost relative to your investment. This is especially important in prop firm evaluations and strategy comparisons. Percentage metrics are also useful for comparing total profit across different account sizes or trading strategies.
Formula: PnL % = (PnL / Initial Investment) × 100%
Example: You invest $1,000 in a trade and earn $250. Your PnL percentage is:
(250 / 1,000) × 100% = 25%
This metric helps standardize performance across accounts of different sizes and is used to compare the effectiveness of various strategies or trading periods. A 10% return on $10,000 carries more weight than simply knowing a $1,000 gain, particularly in professional evaluations.
Prop firms commonly set goals and risk limits in percentage terms, such as achieving a 10% return or avoiding a 5% drawdown. This makes percentage-based tracking crucial for traders seeking funding.

When to Use Each Type of PnL
Both types of PnL offer valuable insights, and it’s a common practice among professional traders to monitor both price-based and percentage-based PnL side by side.
Use price-based PnL when:
- Managing position sizing
- Setting precise entry, stop-loss, and take-profit levels
- Tracking real-time gains and losses in your broker’s platform
Use percentage-based PnL when:
- Comparing different strategies over time
- Meeting performance targets in prop firm challenges
- Evaluating the return on investment (ROI) across multiple trades or accounts
For example, a trader might use price-based PnL to calculate exact dollar risks per trade, while using percentage-based PnL to ensure they’re staying within firm-wide risk limits or reaching performance benchmarks.
Price-Based vs. Percentage-Based PnL
| Aspect | Price-Based PnL | Percentage-Based PnL |
| Unit of Measurement | Dollars or account currency | Percentage of capital |
| Use Case | Managing trade size and stop loss | Evaluating strategy performance |
| Common in | Broker dashboards and real-time data | Prop firm evaluations and analysis |
| Reflects | Absolute profit or loss | Relative return on capital |
| Ideal for | Risk management and execution | Strategy comparison and tracking |
Useful Tools for Calculating PnL
Real-time dashboards:
Track open and closed positions, floating PnL, and total equity live on broker and prop firm platforms.
PnL explained reports:
Break down trade value, fees, commissions, and new trades to give insight into what drives profit or loss.
Manual calculations & exports:
Allow traders to analyze performance offline, compare historical data, and verify metrics across strategies.
Position size calculators:
Help determine optimal lot size per trade based on account balance, risk percentage, and stop-loss distance.
Trade-based analytics:
Highlight which trading strategy or setup contributes most to performance, including win rate, average R, and consistency.
Impact calculators:
Estimate how new trades will affect equity curves or breach drawdown limits in prop firm evaluations.
Final Thoughts
PnL is more than just a number, it’s a reflection of your trading decisions, risk control, and overall strategy. Whether you calculate it in price or percentage terms, understanding your PnL is essential for making informed decisions and improving performance.
For prop firm traders, tracking both realized and unrealized PnL, staying within drawdown limits, and analyzing trade value through tools like PnL explained reports can determine whether you pass or fail an evaluation. These tools make calculating PnL explained clearly and transparently, helping you break down profits, losses, and execution quality in detail.
By consistently reviewing your PnL and adjusting your approach, you gain the insights needed to refine your trading strategy and grow with confidence in any market environment.
Take Your Trading to the Next Level with Top One Trader. Whether you’re sharpening your edge or aiming for funding, Top One Trader offers everything you need to grow:
- Real-time dashboards
- Educational resources and trade analytics
- Multiple evaluation challenges to fit your style
Join a prop firm that supports your performance every step of the way.
How Many Trading Days in a Year?
When most people think about trading, they picture price charts, technical setups, and market strategy. But there’s a simple question that often gets overlooked: How many trading days are there in a year?
This basic detail can shape how you set goals, evaluate performance, and plan trades. In this guide, we’ll break down what qualifies as a trading day, how many to expect annually, and what factors, like holidays and global markets, can shift that number.
What Are Trading Days and Why Do They Matter?
In simple terms, a trading day is any weekday when the market is open and available for buying and selling. For U.S. markets, major exchanges like the NYSE (New York Stock Exchange) and Nasdaq follow a standard schedule; these markets open Monday through Friday, from 9:30 AM to 4:00 PM Eastern Time, excluding certain holidays.
So, why does this matter? For anyone actively involved in financial markets, whether you’re scalping small price moves or riding long-term trends, knowing when you can and can’t trade is foundational. Missing just one trading day could mean missing a big gain or avoiding a big loss. Either way, you can only act when the market is open.
So, How Many Trading Days Are There in a Year?
On average, U.S. stock markets have 252 trading days each year. That’s the average number most traders and analysts use when doing annual calculations. But let’s break down how we get there.
A typical year has 365 calendar days. Out of those:
- 104 are weekends (52 Saturdays and 52 Sundays)
- Around 9 are market holidays like Independence Day, Thanksgiving, or Christmas
When you subtract weekends and holidays, you’re left with roughly 252 days when markets are open, giving traders plenty of opportunities to capitalize on market movements.
Here’s the quick math:
365 (total days) – 104 (weekends) – 9 (holidays) = 252 trading days
Now, this number isn’t set in stone. Some years will have 250, 251, or even 253 or 254 trading days, depending on where holidays fall and whether it’s a leap year. For instance, in 2020, the total was 253 trading days. In contrast, 2021 landed exactly at 252. These slight variations may seem trivial, but for full-time traders, every single day or session counts.
What Can Cause the Trading Day Count to Change?
There are a few moving parts that influence how many trading days you’ll get in a year:
1. Weekends and Recognized Holidays
Markets close on weekends, without exception. On top of that, there are established U.S. market holidays. If a holiday like Christmas falls on a Saturday, it may be observed on the Friday before. These adjustments shave off a trading day here and there.
2. Unexpected Market Closures
Sometimes, exchanges close down for reasons outside the usual calendar. Think back to Hurricane Sandy in 2012, that storm shut down U.S. markets for two full days. Historical moments like the 9/11 attacks also led to unscheduled closures. And in 2018, markets closed for a day in honor of President George H.W. Bush’s passing.
3. Regional Market Variations
Each country sets its own trading calendar based on local holidays and cultural observances. So, the number of trading days in Japan or the U.K. won’t match the U.S. exactly. That matters if you’re involved in global markets or trading ADRs (American Depositary Receipts).

How Do You Calculate Trading Days Yourself?
If you ever want to estimate it manually, it’s pretty simple:
| Number of days in the year – number of weekends – number of market holidays = Trading days |
Most traders, however, prefer to use a trading calendar from their broker or financial data provider. It saves time, and these tools often account for irregularities like half-days or surprise closures.
Stay ahead of the market with Top One Trader’s Economic Calendar. Track active trading days, key economic events, and major news releases to plan your trades more effectively. Stay prepared and trade with confidence!
Trading Beyond the Bell: Extended Trading Hours
While the standard session runs from 9:30 AM to 4:00 PM ET, many traders, especially banks and institutions, also operate during extended hours. These include:
- Pre-market: Often from 4:00 AM to 9:30 AM ET
- After-hours: Typically from 4:00 PM to 8:00 PM ET
These windows offer more time to react to earnings reports, economic data, and global news. But trading outside regular hours isn’t for everyone. Volume is thinner, spreads are wider, and volatility can spike unexpectedly. Still, if used wisely, extended trading can be a strategic edge.
Some brokers like Lightspeed make it easier by offering “Day+” orders, which automatically include these hours. Others require you to manually change the settings, something worth checking if you’re thinking of venturing beyond the 9:30–4:00 window.

A Look Around the Globe: Not Every Market Follows the Same Rules
Let’s take a quick glance at how trading days differ across key markets:
- NYSE/Nasdaq (U.S.): About 252 trading days with regular trading sessions.
- London Stock Exchange (LSE): Stock prices operate around 253 days, closed on U.K. bank holidays.
- Hong Kong Exchange (HKEX): About 250 days, with breaks for Chinese New Year and other local holidays.
- Tokyo Stock Exchange (TSE): Roughly 245–250 days, impacted by holidays like Golden Week.
Time zones also create an interesting dynamic. For example, if you’re a stock trader based in California, you’re looking at trading from 6:30 AM to 1:00 PM, moving through multiple trading sessions at a different rhythm than someone on the East Coast.
What About Forex and Crypto?
If you’re trading forex or crypto, you’re playing by a different set of rules altogether:
- Forex (Foreign Exchange): The forex market operates 24 hours a day, five days a week, beginning Sunday evening and running through Friday evening U.S. time. This schedule offers approximately 260 trading days per year. While the market is technically open even on certain holidays, such as New Year’s Day, trading activity is minimal. During these times, most central banks, financial institutions, and major liquidity providers are closed, resulting in very low volatility.
- Crypto Markets: These never close. Literally 24/7/365. You can trade Bitcoin on Christmas morning or a Sunday night. It sounds liberating, but the constant activity can be mentally draining. Many crypto traders set personal schedules to avoid burnout.
Understanding Trading Time Frames: Finding the Right Window for Your Strategy
When it comes to trading, timing is everything. But we’re not just talking about picking the right entry or exit moment; we’re also talking about choosing the right time frame. Whether you’re scalping tiny movements or holding for days, the time frame you choose shapes your entire approach. It influences your trade frequency, risk profile, and even how many trading days in a year truly matter to you.
Let’s dive into how different time frames work and how they connect with your broader strategy and calendar planning.
Lower Time Frames: Fast, Intense, and Demanding
Time frames like 1-minute, 5-minute, and 15-minute charts are favorites among scalpers and high-frequency traders. These traders are looking for tiny price movements, fractions of a percent that they can trade multiple times in a session.
Here’s what you should know:
- You might enter and exit trades in seconds or minutes.
- Every trading day counts; you’re using nearly all 252 trading days per year.
- The smaller the time frame, the more trades you’ll likely take, but also the more noise you’ll deal with.
This style requires quick reflexes, reliable internet, and a strong mindset. Many traders using these charts stick to the most volatile periods, like the first and last hour of the trading day.
Intermediate Time Frames: Balance Between Speed and Patience
30-minute (30m), 1-hour (1H), and 4-hour (4H) charts serve as the middle ground. These are ideal for intraday traders who don’t want the intensity of scalping or the slow pace of long-term investing.
Why use these time frames?
- They provide a clearer picture of price movement than minute-based charts.
- You can spot strong patterns and trends while still being active on most trading days.
- Many swing traders use these charts to enter trades that last a few days to a week.
This level of trading still relies on having a good count of trading days per year, as you’ll be in and out of trades relatively often but with more breathing room.
Higher Time Frames: Zooming Out for the Bigger Picture
Now we’re talking about Daily, Weekly, and even Monthly charts. These time frames are the playground of trend-followers, position traders, and long-term investors.
The benefits are clear:
- Less stress, fewer trades.
- Clearer, more reliable signals.
- Ideal for traders who work full-time or don’t want to stare at screens all day.

Using the daily chart, a trader might only place a few trades per month. With weekly or monthly charts, you might enter a position and hold it for months or even years. Here, the number of trading days in a year becomes less important than what happens during them.
Final Thoughts: Using Trading Days to Your Advantage
Understanding how many trading days are in a year is just the start. The real power comes from knowing how to use them wisely. The market offers an infinite number of opportunities. How you approach them through scalping, day trading, or swing trading should reflect your personality and lifestyle.
If you’re someone who thrives on action, lower time frames and full use of all trading days may suit you. If you prefer a calm, calculated approach, focus on higher time frames and pick your moments.
No matter your trading style, choosing the right time frame and aligning it with your goals and the market calendar can make all the difference. It can turn trading from a stressful, random activity into a more consistent and sustainable routine.
Take time to plan your year, match your strategy to your schedule, and remember: it’s not about how many trades you take, but about the quality of your setups, how well you manage risk, and how wisely you use your time and trading days.
Ready to take your trading skills to the next level? Whether you’re into scalping, day trading, or swing trading, Top One Trader offers funded trading accounts, letting you trade real capital in the financial markets and keep up to 90% of the profits. Apply today and start trading like a pro!
Frequently Asked Questions (FAQs) About Trading Days and Time Frames
Can I trade every day of the year?
Not if you’re trading stocks. The U.S. stock market is only open about 252 days per year, excluding weekends and public holidays. If you trade forex, you get around 260 days, and with crypto, you can technically trade 24/7 all year long.
What’s the best time frame for beginners?
For beginners, it’s better to start with the daily chart because it’s less chaotic. It gives you time to think, plan, and learn how price action works. Once you’re confident, you can explore lower time frames if you want more activity.
Do different markets have different time frames?
Yes, and they also have different levels of volatility. Crypto, for instance, moves fast even on higher time frames. Forex has different session overlaps, affecting trade opportunities. Stocks are most active at the open and close.
Can I mix time frames?
Absolutely. Many traders use a method called “multiple time frame analysis.” For example, they’ll use a 4H chart to find a setup, but enter the trade on a 15-minute chart for better precision.
What Does TP Mean in Trading?
In the world of financial markets, knowing when to enter a trade is only half the battle. Knowing when and where to exit can make all the difference between consistent profits and frustrating losses. This is where Take Profit (TP) comes into play.
TP, short for Take Profit, is a type of trading order that allows you to close your position once the market reaches a predefined profit level. It’s not just a convenience, it’s a core part of any solid risk management strategy. By removing emotion from exits and ensuring your trades are closed at optimal levels, TP orders help traders secure profits, manage risk, and build discipline over time.
While Stop Loss (SL) orders are designed to protect you from large losses, TP orders serve the opposite purpose, they lock in gains once the market moves in your favor. Together, they form the foundation of a balanced trading plan. But in this article, our focus is exclusively on TP: What does TP mean in trading, how it works, why it matters, and how to use it effectively in today’s volatile markets.
Understanding Take Profit Orders
A Take Profit (TP) order is a limit order that automatically closes your open position once the price reaches your profit target. Unlike market orders, which execute immediately at the current market price, a TP order executes only when the price reaches a specific level, or your preset limit price. This makes it a smart, controlled way to exit a profitable trade without needing constant monitoring.
Let’s break it down:
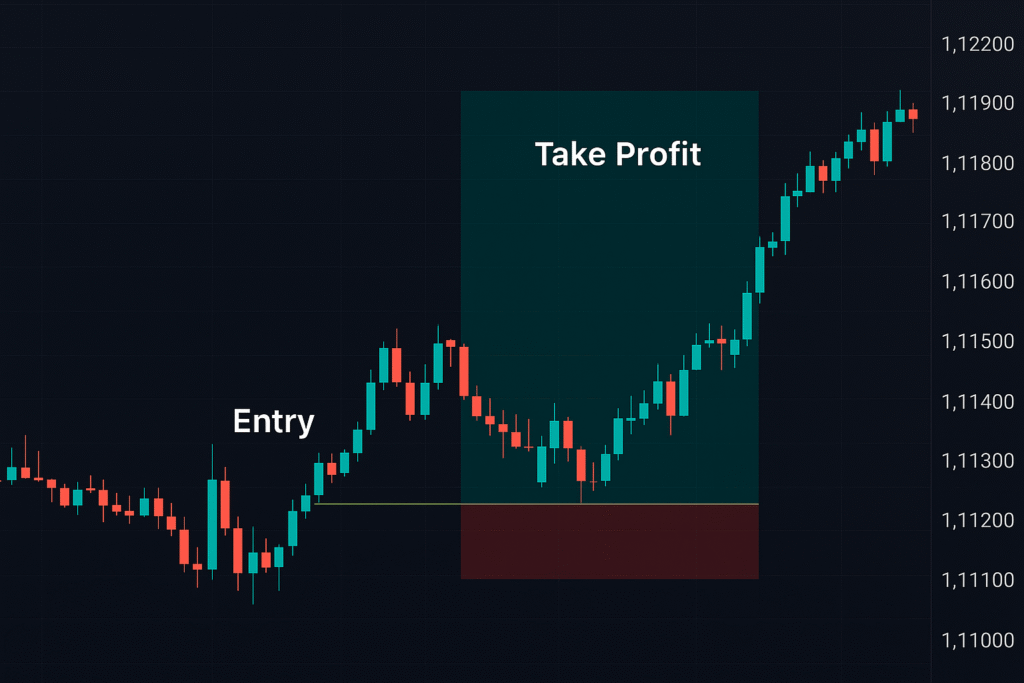
You enter a long position (buy) on the EUR/USD currency pair at 1.11220.
You want to target a 70-pip gain, so you set your take profit level at 1.11920.
When the price reaches 1.11920, the trading platform will automatically close your trade, locking in your profit, without any further action required on your part.
This Take Profit order allows you to exit the trade at your desired profit level, even if you’re not actively monitoring the chart.
TP orders are widely supported across every trading platform. Whether you’re trading forex, stocks, commodities, or crypto, the mechanics are the same: define a price, and your platform will automatically sell (or buy back) your position once that profit level is met.
This automated function makes TPs especially valuable in fast-moving or volatile markets, where reacting in real-time isn’t always possible. It also helps eliminate emotional decision making, which can derail even the most experienced traders during live trading.
Strategic Placement of Take-Profit Orders
Setting a take profit (TP) isn’t just about picking a number that “feels right.” Skilled traders rely on a combination of technical analysis, risk management tools, and market conditions to determine precisely where and when to place TP levels.
Below are some of the most effective methods traders use to set take profits with confidence and consistency:
1. Support and Resistance Levels / Swing Points
These are key price levels where the market has previously reversed or stalled. They often act as strong psychological barriers and are commonly used as TP targets. In a long trade, traders typically set the TP just below resistance, while in a short trade, it’s placed just above support to secure profits before a potential reversal.
Example: If a stock has repeatedly failed to break above $150, setting your TP at $149.50 helps you exit safely before the next rejection zone.
2. Higher Time Frame Candles (Daily, Weekly, Monthly)
Some traders use the highs and lows of previous higher time frame candles as natural take profit zones. For instance, a day trader operating on the 30-minute or 1-hour chart may set their TP at the high of the previous daily candle, expecting that the price may reach that level before facing resistance.
3. Candlestick Patterns
Certain candlestick formations, such as engulfing candles or doji,s can signal exhaustion or a potential reversal. Traders often use these patterns to time exits and place TPs just before the next resistance or structural barrier, especially when trading on lower time frames.
4. Technical Indicators (RSI, MACD, Volume)
Indicators can add confluence and confidence to TP placement:
- RSI: Used to identify overbought or oversold conditions where a reversal is likely.
- MACD: Watch for momentum shifts or bearish/bullish crossovers.
- Volume: Spikes in volume may signal the end of a move or confirm trend strength.
Example: If RSI is approaching overbought and your TP is just below resistance, it adds extra validation for exiting the trade.
5. Fibonacci Retracement Levels & Multi-Target Strategy
Fibonacci tools are commonly used to identify precise levels where price may react or reverse, especially in trending markets. A popular entry zone is the Golden Zone, between 0.618 and 0.786.
From this entry area, traders often set TPs at predefined Fibonacci-based extensions:
- TP1 at 0 (previous swing high or low)
- TP2 at -0.3
- TP3 at -0.55
Also, traders use this multi-TP approach to secure profits incrementally as the trade moves in their favor:
- Take 50% at TP1
- Take 30% at TP2
- Take 20% at TP3
This method helps reduce exposure to risk and ensures you lock in gains early—even if the market reverses before reaching your final target. It’s especially useful in volatile conditions where price may struggle to reach the full projected move. At the same time, it allows part of your position to remain active, giving you a chance to participate in larger, trend-driven moves without risking your entire trade. It’s a perfect balance between consistency and opportunity.
Example: GBPNZD
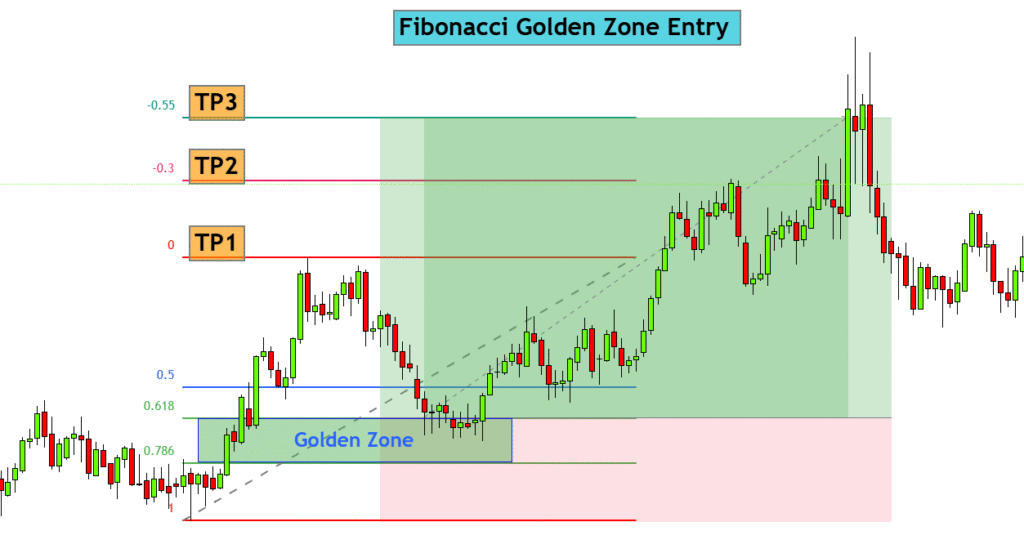
- Entry: Buy at the 0.618 retracement
- TP1: 0
- TP2: -0.3
- TP3: -0.55
Using Fibonacci helps traders set mathematically grounded targets instead of emotional exits.
6. Economic Calendar and News Events
Price can move rapidly during high-impact news like interest rate announcements, NFP (Non-Farm Payrolls), or major geopolitical developments. Traders often adjust their TP targets around these events to lock in gains early or give trades more room depending on expected volatility.
Examples:
- In quiet sessions, you can place tighter TPs.
- In volatile conditions, consider setting wider targets or exiting positions ahead of key news releases.
Stay ahead of the market with Top One Trader’s Economic Calendar, track important news events across major markets that can impact your trades, so you can stay prepared and trade with confidence.
7. Multiple Time Frame Analysis (MTFA)
A strong Take Profit strategy doesn’t rely on a single chart or timeframe. Multiple Time Frame Analysis (MTFA) is a powerful top-down method that helps traders align their take profit levels with the broader market structure, increasing the odds that those levels will be respected.
Here’s how MTFA works in practice:
Start with a higher time frame like the Daily or 4H chart to identify the dominant trend, key supply and demand zones, and overall market direction. These zones are institutional footprints where price has previously reacted with strength, making them ideal TP targets.
Zoom into a lower time frame, such as the 1H or 15-minute chart, to refine your entry trigger within or around those higher time frame zones. This is where you’ll also set more precise TP levels, often just before the next opposing supply or demand zone.
Using MTFA ensures your TP isn’t based on guesswork; it’s built around structural market behavior and price context, giving your trade a higher chance of reaching its objective without randomness.
Test Before You Trade: Backtesting Your Take Profit
Placing TP levels based on theory is a good start, but to truly improve your strategy, you need real data. Backtesting allows you to evaluate how well your take profit levels perform across different markets, timeframes, and trading conditions.
By backtesting, you can:
- Identify which market environments your strategy performs best in
- Avoid repeating costly mistakes
- Determine whether your TP targets are realistic, too aggressive, or too conservative
Whether you use backtesting tools or manually track trades on platforms like TradingView, Excel, or a trading journal, the goal is the same: to refine your TP placement based on outcomes, not assumptions.
Here are a few key questions to ask during review:
- Did prices frequently hit my TP levels?
- Were my TPs too ambitious, or did I exit too early?
- How did different market conditions (trend, range, volatility) impact the results?
Once you’ve completed your backtesting, you’ll have a clearer picture of what works, supported by data you can rely on. This gives you the confidence to trade your plan, knowing your TP method is not only logical but proven.
Putting It All Together entry point, stop loss and take profit
A successful trade setup isn’t just about spotting the right entry; it’s about building a complete plan that includes your entry point, stop loss (SL), and take profit (TP), all aligned with market structure and logic.
Start by defining your entry using confirmation such as price action, candlestick patterns, or breakouts at strong levels. Don’t guess, let the setup come to you.
Next, place your stop loss where your trade idea is invalidated beyond recent swing highs/lows or key supply/demand zones. This protects your capital and defines your risk.
Then, set your take profit with a positive reward-to-risk ratio, ideally between 2:1 and 4:1. This means you’re aiming to earn 2 to 4 times more than you risk on each trade. Combined with a win rate of just 40% or more, this math gives you long-term profitability.
This is the balance that professional traders aim for: a system where even with modest accuracy, the payout from winners far outweighs losses. When you plan your entry, SL, and TP before the trade, you remove emotion and execute with confidence, consistency, and control.

Common Mistakes When Using TP
Even though a Take Profit order seems simple on the surface, many traders struggle to use it effectively. Here are some of the most common errors that can reduce profitability:
1. Setting TP Too Close to Entry
Many traders, especially beginners, place their TP levels too close to the entry price. While this might provide a quick win, it often cuts trades short before the full move unfolds. In volatile markets, price needs room to fluctuate. If your TP is set right above support or resistance without any buffer, you might exit prematurely and miss the real profit potential.
2. Setting TP Unrealistically Far
On the flip side, placing your Take Profit level too far from the current price often leads to missed opportunities. If your target is based on hope rather than technical analysis, the market may never reach it. This can turn a winning trade into a breakeven or worse. A TP should be challenging, but still realistic based on your trading strategy and market conditions.
3. Ignoring Market Conditions
TP levels should always be placed with changing market dynamics in mind. For example, during periods of low volatility, prices may struggle to reach wide targets. During high-impact news events, your TP might need to be adjusted to protect existing profits. Using a fixed TP without adjusting to current price action is a mistake.
4. Over-Optimizing or Second-Guessing
It’s common to change your TP mid-trade, especially when you’re watching the market live. But this often leads to emotional decision making. Unless you have a structured reason, like a shift in trend or new support/resistance levels forming, it’s best to stick to your plan.
5. Not Journaling TP Performance
Without a trading journal, it’s hard to know if your TP strategy is actually working. Are your TPs getting hit consistently? Are you leaving too much on the table? Tracking this data helps refine your risk-reward ratio, improve entries, and better manage risk over time.
Final Thoughts
Take Profit orders are more than just exit points; they’re essential tools for protecting gains, managing risk, and trading with discipline. By combining sound strategy, proper placement, and data-backed adjustments, your TP approach can turn a decent trade into a consistently profitable one.
Whether you’re trading forex, stocks, or crypto, planning your TP alongside your entry and stop loss gives you clarity, confidence, and control in any market condition.
Ready to level up your trading?
Join Top One Trade, a prop firm built for traders like you. Get access to strategy tools, educational resources, and the support you need to grow and refine your trading. Start smart. Trade better.
What is SL in trading?
In trading, nothing is guaranteed. The moment you have an open position, you’re exposed to market fluctuations and potential downside risk. You can’t control price action, breaking news, or sudden volatility. But you can control how much you’re willing to lose and how you handle emotional decision making when the market turns against you.
That’s why successful traders don’t just chase profits; they focus on protecting their capital. Using a stop loss order is one of the simplest yet most powerful ways to limit losses and stay disciplined. No matter your trading strategy or account size, risk management should always come first.
In this guide, we’ll break down how experienced traders protect themselves from unpredictable market movements, stay in control of their trades, and build consistency even when the market is anything but predictable.
What is a Stop Loss in Trading?
A stop loss order is a key risk management tool used to exit trades at a predefined stop price. When the current market price reaches this stop loss, the order is executed automatically, closing the trade to prevent further losses. This type of stop loss order is useful when the market moves against your position.
For example, if you buy a stock at $100 and place your stop loss order at $95, that $95 becomes your trigger price. Once the stock price drops to this level, the SL is activated and typically becomes a sell market order. This helps you exit early and avoid larger losses.
While stop losses are commonly used to protect buy orders, the same principle applies to sell orders in short trades. When you place a buy order with a stop loss, the stop loss becomes a sell market order once the price hits the stop level. Conversely, if you initiate a sell order, the stop loss transforms into a buy market order when the price reaches the stop.
In both scenarios, the stop loss order acts like a safety net, helping you exit quickly, avoid emotional decision making, and protect your capital from huge losses during sudden market reversals.

Types of Stop Loss Orders
There’s no universal stop loss that works for every trader or strategy. The ideal SL type often depends on your trading style, market conditions, and personal risk tolerance. Below are the most commonly used types of stop loss orders and how they work.
1. Fixed Stop Loss
A fixed stop loss sets a specific price distance from your entry point, typically measured in pips, points, or dollars. For example, a trader might always risk $50 per trade, placing their stop loss exactly that amount away from the entry.
This approach is simple and consistent, making it great for beginners or automated systems. However, it doesn’t adapt to market volatility, which can sometimes result in premature stop-outs.
2. Percentage-Based Stop Loss
This type of stop loss is calculated as a percentage of your account balance or position size. For instance, risking 1% of a $10,000 account would mean setting a stop loss that limits your loss to $100.
Percentage-based SLs are great for maintaining consistent risk management. They scale with your account size, helping you avoid overexposure. However, they may ignore important price structure or market behavior.
3. ATR-Based Stop Loss
With this method, you place your stop loss at a multiple of the ATR value away from your entry, for example, 1.5 times the ATR.
ATR-based stop losses are ideal in volatile markets because they adjust dynamically. This allows your stop loss to “breathe” with the market, reducing the chances of being stopped out by price fluctuations.
4. Trailing Stop Loss
A trailing stop loss moves along with your trade as it becomes profitable. If the market goes in your favor, the SL follows at a set distance, locking in profits while allowing the trade to run.
This is a popular choice for trend-following strategies, as it helps maximize gains without needing manual adjustment. However, it can be triggered if the price makes a deep retracement before continuing in your favor. It can be applied manually or automatically, depending on your preference.
5. Mental Stop Loss
A mental stop loss is when a trader sets a personal exit level in their mind but does not place an actual order in the system. Instead, they monitor the market and manually close the trade if the price reaches that level.
While this approach offers flexibility, it requires a high level of discipline and real-time decision-making. It’s considered risky for most retail traders, especially in fast-moving or prop firm environments, where hesitation can lead to larger-than-expected losses.
That said, mental stop losses are sometimes used by hedge fund managers and institutional traders with 10+ years of experience. These professionals often combine deep market understanding with advanced risk control, allowing them to react swiftly without relying on preset orders.
For most traders, especially those still building consistency, placing a stop loss in advance is the safer and more reliable choice.
Ready to trade smarter? Use the Top One Trader Position Size Calculator to determine the perfect lot size for every trade based on your stop loss level, account size, and the asset you want to trade.
Stop Loss: Pros and Cons by Type
| Type | Pros | Cons |
| Fixed | Simple and consistent | Doesn’t adapt to volatility |
| Percentage-Based | Scales with account size | May ignore price structure |
| ATR-Based | Adjusts to market volatility | Can be complex for beginners |
| Trailing | Locks in profits as price moves | May trigger too early during pullbacks |
| Mental | Flexible and invisible to the market | Prone to emotional mistakes; requires experience |
Different trading styles call for different approaches. Scalpers often use tight, fixed stop losses to control risk, while swing traders might prefer ATR-based or percentage-based stop losses to accommodate wider price movement.
How to Determine the Best Stop Loss Level
A stop that’s too close to your entry point can trigger prematurely, while one placed too far exposes you to unnecessary risk and damages your risk-to-reward ratio.
Several reliable methods help traders set stop loss orders at optimal levels. A common technique involves placing the stop just beyond key support or resistance zones. Typically, for a long position, the stop price is placed slightly below support; for a short position, it’s set just above resistance. These levels frequently prompt price reactions, creating logical areas to limit your risk.
Another useful method involves recent swing highs and lows, as these points are often challenging for a price to break through. Traders regularly use these swing levels as potential entry points, waiting for confirmation before targeting a reversal and placing stops just beyond these levels.
Session-based logic also provides effective stop placement. For instance, placing your stops slightly beyond the London or New York session highs or lows can protect against common stop hunts during these highly volatile trading sessions. Once the price reaches your stop price, it triggers a stop loss market order, automatically closing your trade and protecting your capital.
Whatever method you choose, never place your stop loss randomly. Instead, align it with your trading strategy, market structure, anticipated volatility, and personal risk tolerance. A thoughtfully placed SL order not only limits losses but also enforces discipline.
Stop Loss by Trading Style
- Each trading style requires a distinct approach:
- Swing Trading: Wider stops generally 50–100+ pips, placed near daily support, resistance, or trendlines, allowing for greater flexibility and longer trade durations.
- Scalping: Tight stops of around 3–10 pips, based on minor price movements. Quick execution is crucial.
- Day Trading: Moderately tight stops typically between 10–40 pips, referencing session highs/lows or intraday structures on 15-minute to 1-hour charts.

Smart Stop Loss Strategies That Actually Work
To optimize your stop loss price, apply strategies that reduce emotional decisions and adapt to market conditions:
- Move SL to Breakeven
After the price hits your 1R target price, shift your SL to the entry price. This protects capital without capping potential. - Partial Take Profit + Breakeven
Take partial profits at 1R or 2R, then adjust your SL to eliminate risk on the remaining portion of the trade. - Trailing Stop Behind Structure
As price forms higher lows in an uptrend or lower highs in a downtrend, move your SL behind the new structure. - Time-Based Exit Logic
If price fails to move favorably within a defined time window (e.g., X bars or a trading session), exit the trade to avoid tying up margin. - SL Journaling
Track your SL performance to identify patterns: Did you get stopped due to poor entry, normal volatility, or ignoring a key price level?
Finally, using multiple time frame analysis can greatly improve how you place your stop loss. Start by identifying the main trend on a higher time frame, then look for key levels or points of interest on a middle time frame.
Use a lower time frame to time your entry. This approach helps you place your stop loss more accurately, improves your risk-to-reward ratio, and shows you exactly where the price is likely to react.
Common Stop Loss Mistakes
Many traders don’t fail because of bad trade ideas, but because of poorly placed stop losses. Here are some of the most common mistakes to avoid:
One major error is placing the stop loss too tight. When your SL is too close to your entry, even normal price fluctuations can trigger it. This leads to getting stopped out before the trade has a real chance to play out.
Another common mistake is moving your stop loss emotionally after entering a trade. Shifting your SL out of fear or hope removes structure and consistency from your trading system. This often leads to bigger, undisciplined losses.
Some traders also suffer from inconsistent SL placement, where there’s no clear logic or repeatable method. Without a structured approach, you can’t evaluate or improve your strategy effectively.
Others ignore session volatility and market gaps, placing stops without accounting for high-impact times like the London or New York open. This increases the chance of being taken out by sudden spikes, even if your trade direction is correct.
Finally, setting the SL too wide can be just as dangerous. While it may reduce the chance of being stopped out, it weakens your risk-to-reward ratio, making it much harder to achieve long-term profitability.
To avoid these issues, always backtest your stop loss logic. Use journaled trades and analyze how your SL behaves across multiple time frames. That way, your stop loss becomes a strategic tool, not just a safety net.

Stop Loss and Trader Psychology
A well-placed SL does more than protect your account, it helps regulate your emotions and decision-making.
- Reduces fear of losing money
- Prevents overconfidence after a winning streak
- Builds trust in your trading strategy
- Reinforces discipline through journaling and post-trade analysis
Especially in prop firm trading, the ability to set stop losses and stick to them is what separates professional traders from emotional ones.
Final Thoughts: Why Stop Losses Matter
In trading, uncertainty is the only constant. You can’t control the markets, but you can control your risk, and that’s where a well-placed stop loss comes in.
More than just a technical tool, the stop loss level you choose reflects your discipline, your planning, and your commitment to protecting your capital. It helps remove emotion, define your risk, and keep your trading strategy consistent even in volatile markets.
Successful traders don’t just chase profits; they focus on limiting potential losses and making decisions based on logic, not fear. Whether you’re a beginner or experienced, mastering how you set stop losses is a vital step toward long-term success.
Take your trading to the next level with Top One Trader. The platform supports various strategies and provides educational resources to help you build and refine your own strategy. Start trading today and gain access to the tools and support needed for success.