
Improve Your Trading Decisions with Trend Exhaustion Indicator
Checked by the Top One Trader editorial team, experienced traders and analysts are committed to providing reliable, practical insights for funded trading success.
Trend analysis is the heartbeat of every market. It guides traders in positioning their trades in the right direction, spotting opportunities, timing entries, and riding momentum for profits. But no trend lasts forever. At some point, momentum weakens and price begins to reverse or correct, often leading to unexpected losses.
This stage, known as trend exhaustion, can catch traders off guard if ignored. Recognising it not only helps avoid unnecessary losses but also uncovers valuable setups.
In this guide, we’ll break down what trend exhaustion is, how to identify it, and how the Trend Exhaustion Indicator can support smarter trading decisions.
Key Takeaway
- Trend exhaustion happens when buying or selling momentum fades, causing the price to stall, correct, or reverse direction.
- By combining price action, momentum indicators like RSI, and tools such as volume or supply and demand zones, traders can identify exhaustion more reliably.
- Using the Trend Exhaustion Indicator adds visual confirmation, helping traders avoid late entries, manage risk, and turn potential turning points into profitable opportunities.
What is Trend Exhaustion?
Trend exhaustion is the stage where a strong move begins to lose momentum. Buyers in an uptrend or sellers in a downtrend gradually run out of strength, and price struggles to push in the same direction. It doesn’t mean the trend ends instantly, but it signals the market may be close to a reversal or at least a corrective phase.
For traders, recognising this moment is crucial. Entering too late into a fading trend often results in small gains or unexpected losses when the price flips direction. By learning to spot trend exhaustion, you gain the ability to anticipate when the crowd is running out of conviction. This helps you avoid chasing moves and instead prepare for opportunities when the market changes. Just like every market cycle begins and grows, every cycle also weakens, and exhaustion is the natural sign that change is coming.
How to Identify Trend Exhaustion
Traders rely on a combination of tools and price action clues to confirm when a trend may be running out of steam.

- RSI (Relative Strength Index) and MFI (Money Flow Index):
These indicators can be used in two ways to spot exhaustion: first, by watching how they behave in overbought or oversold zones. If RSI or MFI enters an extreme level and then starts to revert, it can suggest that momentum is fading and a potential trend exhaustion is near.
Second, by looking for divergences between the price and the indicator. For example, if price forms a higher high in an uptrend while RSI or MFI forms a lower high in overbought territory, it highlights weakening momentum and warns that sellers may step in to drive price lower. - Volume:
Strong trends usually come with rising volume. If volume drops near a peak or bottom, it indicates the price is losing momentum and the trend is weakening. - Candlestick Rejections:
Strong rejection candles, such as pin bars, shooting stars, or hammers, forming against the prevailing trend often indicate exhaustion. In an uptrend, a large bearish rejection candle suggests sellers stepping in to drive prices lower. In a downtrend, a bullish rejection candle signals buyers are willing to push prices higher. - Moving Averages:
When price moves too far from a major moving average, it often signals stretched momentum and a likely correction. A decisive break of the average can indicate a potential pullback or even a trend reversal, while crossovers between short- and long-term averages confirm shifting strength. - Market Structure:
A change of character, when price breaks the last swing high in a downtrend or the last swing low in an uptrend, often signals that trend momentum is weakening and a potential reversal may follow. - Supply and Demand Zones:
Key resistance or support zones frequently act as exhaustion points where opposing orders absorb momentum, forcing the price to stall or reverse. - Chart Patterns:
Formations like double tops, double bottoms, cup and handle, or head-and-shoulders patterns are structural signs that a prevailing trend may be nearing exhaustion.
No single method is flawless. The key is combining these tools for confirmation. By layering price action, volume, and indicators, traders can build a clearer picture of when exhaustion is likely to occur and position themselves ahead of potential reversals.
Ready to put your strategies to the test? Trade in real markets and keep up to 90% of profits. Start your Top One Trader-funded account challenge today and prove your edge in the markets
Trend Exhaustion Indicator
The Trend Exhaustion Indicator was designed to simplify one of the hardest tasks in trading: recognising when a trend is about to lose steam. Instead of relying solely on instinct, it gives traders visual cues that highlight exhaustion points directly on the chart.
The indicator works by analysing a mix of price momentum, volatility, and patterns. When the market stretches too far in one direction, values plotted by the tool reach extreme levels, suggesting that buyers in an uptrend or sellers in a downtrend may be running out of strength. These signals can act as early warnings that a reversal or correction is near.
The main advantage is clarity. With colour-coded values or plotted markers, the indicator reduces guesswork and helps traders prepare for potential shifts in market direction. It also improves timing, allowing traders to avoid chasing late entries and instead focus on higher-probability setups.
Chart Example:

However, no tool is perfect. The Trend Exhaustion Indicator is not a crystal ball, and false signals can occur. Sudden news events, supply-demand imbalances, or fundamental shifts can override technical conditions. That’s why it works best when combined with price action, RSI, support and resistance, and volume analysis. Used this way, it becomes a powerful tool for spotting exhaustion and managing risk effectively.
Trading Strategies Using the Trend Exhaustion Indicator

The true value of the Trend Exhaustion Indicator lies in how traders apply it. By structuring strategies around its signals, traders can turn early warnings of exhaustion into clear trading setups.
Reversal Setups
When exhaustion appears at a key support or resistance, it often signals a reversal. In an uptrend, exhaustion with a rejection wick at resistance suggests fading demand and a potential short. The opposite applies in a downtrend, where exhaustion at support plus bullish candlesticks can trigger longs.
Continuation Setups
Not every exhaustion reading ends in reversal. Sometimes it marks a short pause before the trend resumes, trapping early contrarians. For example, exhaustion in a downtrend may lead to a small bounce, then sellers take back control. Using RSI, divergence, and volume can help filter out these false signals.
Confirmation Methods
The best trades occur when exhaustion aligns with other tools. If exhaustion forms at resistance, RSI shows divergence, and a bearish engulfing candle appears, the probability rises. Multi-timeframe analysis adds precision, e.g., spotting exhaustion on the daily and refining entry on the 4H chart.
Best Timeframes
Although usable on any chart, short timeframes like 1min or 5min create too much noise. Swing traders usually rely on the 4H and daily, where signals reflect broader market behavior. This improves clarity and avoids chasing false short-term moves.
Risk Management
Risk control is essential. Stop losses should be placed beyond exhaustion points above recent highs in uptrends or below lows in downtrends. Keep risk per trade at 0.25%–0.5% of equity, aim for a take profit of at least 1:2 RR, and use scaling out when RSI or volume confirms continuation.
By combining these methods, the Trend Exhaustion Indicator becomes a reliable guide for trading both reversals and corrections while keeping risk under control.
Common Mistakes and How to Avoid Them

Even with a reliable tool like the trend exhaustion indicator, traders often fall into traps. Misusing signals, ignoring the bigger picture, or applying poor risk management can turn promising setups into costly errors. The table below highlights the most frequent mistakes and the practical steps to avoid them.
| Mistake | Why It’s a Problem | How to Avoid It |
| Over-reliance on the indicator | Treating the trend exhaustion indicator as a stand-alone system creates false confidence. Markets react to news, sentiment, and liquidity that no tool can fully predict. | Always combine the indicator with price action, fundamentals, and other indicators for confirmation. |
| Ignoring fundamentals | Exhaustion signals can fail if strong economic data, central bank actions, or sudden demand continue to push the current trend. | Check the news calendar, track macro drivers, and align signals with broader market context. |
| Poor risk management | Oversizing trades, skipping stop losses, or ignoring volatility can erase profits even from valid setups. | Keep risk small (0.25%–0.5% per trade), always use stop losses beyond exhaustion points, and adapt to market volatility. |
Practical Tips for Smarter Decisions
To make the most of the indicator, traders should combine it with a structured approach:
- Always view signals in relation to the overall market structure.
- Use the indicator to plan, not to predict. Preparation is the edge, not certainty.
- Practice reading exhaustion alongside candlestick behaviour to build confidence.
- Keep a journal of trades to see how exhaustion signals play out across different assets and time frames.
The more a trader learns to connect the indicator with real price action and risk management, the stronger their results become.
Conclusion
Spotting trend exhaustion helps traders anticipate when strong price movements are about to slow. On the chart, this often shows through candlestick patterns, volume shifts, or momentum indication. Whether it signals a trend reversal or just a correction, following clear rules ensures better timing and safer entries.
The right combination of the Trend Exhaustion Indicator, RSI, and support zones highlights when an upward move is weakening or when the beginning of a reversal is near. By reading these clues, traders gain confidence in applying consistent rules and navigating the market with clarity and discipline.
Don’t just study trend exhaustion! Trade It. Apply your skills in live markets with a Top One Trader funded account, and scale up to $500,000 in trading capital. Join now and turn strategy into success.
False Breakout Trading: Spot, Avoid, and Profit from It
Checked by the Top One Trader editorial team, experienced traders and analysts are committed to providing reliable, practical insights for funded trading success.
Every trader has experienced it: price breaks support or resistance, he opens a position expecting the price to continue in his favor. The move fails, the price reverses back, and he gets stopped out. This is a false breakout, one of the most common and costly patterns in trading, and avoiding them can save traders from repeated losses.
In this guide, you will learn the difference between false breakouts and real breakouts, how to identify them, how to manage risk when they occur, and how to use false breakouts in your favor to turn them into profitable trades.
Key Takeaway
- False breakout trading happens when the price briefly breaks support or resistance but fails to hold, trapping traders on the wrong side.
- By combining price action, technical analysis, and risk management, traders can learn to avoid costly mistakes and even profit from these failed moves.
- Understanding how bull traps and bear traps form is key to turning false breakouts into opportunities instead of losses.
What is a False Breakout?
A false breakout occurs when the price breaks above resistance or below support but fails to follow through, quickly returning inside the range. Instead of confirming a new trend, the move reverses, leaving breakout traders trapped in losing positions.
For example, price may break above resistance and attract new buyers, only to slide back under the level within a few candles. Or it may dip below support, trigger short entries, and then rebound higher. These failed moves are clear signals that the breakout attempt has collapsed.
False Breakout Examples
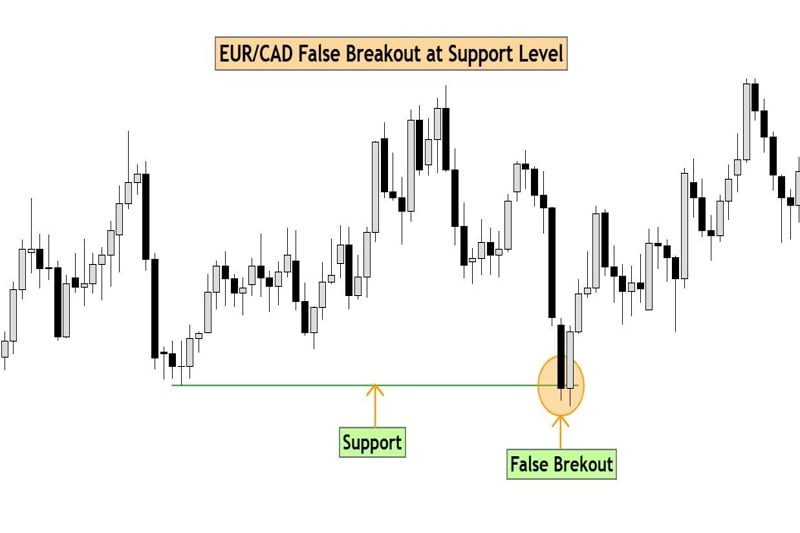
At Support Level (EUR/CAD)
Price breaks below support but quickly reverses back above it. This breakout fails, trapping sellers and shifting price direction upward.
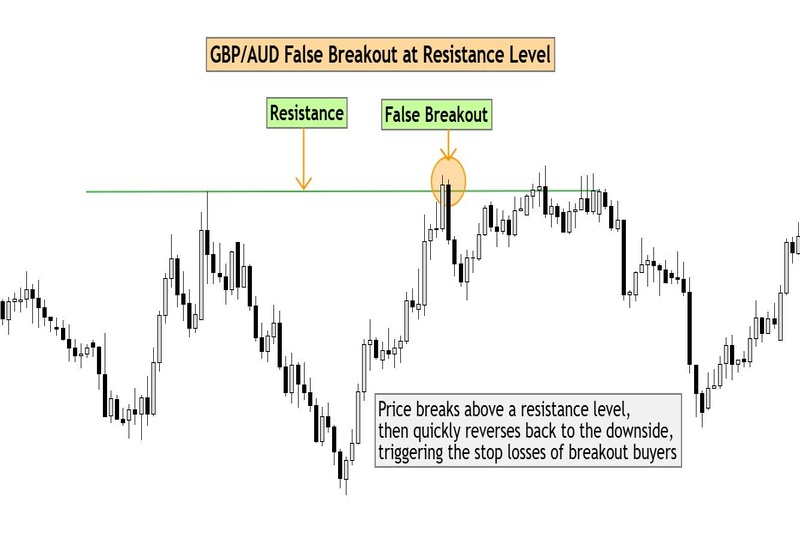
At Resistance Level (GBP/AUD)
Price pushes above resistance, then closes back under the level. When a breakout fails here, buyers are trapped, and price direction turns lower.
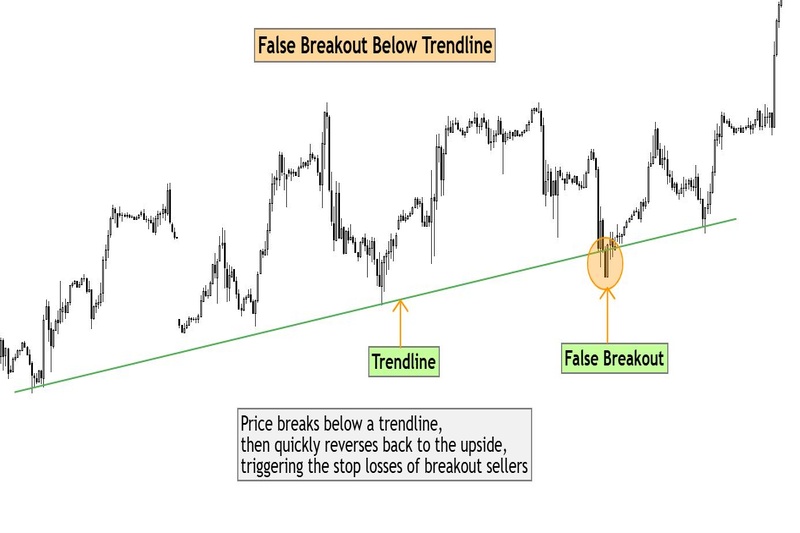
At a Trendline
Price breaks through a trendline but does not hold. The breakout fails, and traders who entered are trapped as the price direction reverses.
Key Differences Between True Breakouts and False Breakouts
| True Breakouts | False Breakouts |
| Price closes beyond support or resistance levels and continues in the breakout direction | Price briefly breaks levels but quickly reverses |
| Supported by rising volume and strong momentum | Lacks volume confirmation, momentum fades quickly |
| Followed by multiple candles in one direction | Usually just 1–2 candles before a reversal |
| Aligns with market structure and dominant trend | Often happens in range-bound markets or counter-trend moves |
In short: true breakouts show commitment, while false breaks reveal hesitation or manipulation.
Why False Breakouts Happen
There are a few common causes:
- Liquidity grabs
Markets need liquidity to move. Larger players will sometimes push prices past a key level to trigger stop losses or attract breakout traders, only to reverse direction once liquidity is collected. - News events
Sudden price spikes during major news announcements often cause fakeouts. The initial surge is emotional and not backed by sustained volume, leading to quick reversals. - Stop hunting
Institutions know where many traders place stops just above resistance or below support. Triggering those stops creates the perfect setup for a false move. - Timeframe conflict
Sometimes what looks like a breakout on a lower timeframe is just a correction against the dominant trend on a higher timeframe. Prices tend to respect higher timeframes more because they reflect a stronger market structure and attract greater trading volume.
This is why many traders say: “The market often breaks levels to trap, not to trend.”
How to Identify a False Breakout
In breakout trading, one of the biggest challenges is knowing whether the price move is genuine or just a trap. False breakouts happen often, and recognising them early can save you from costly mistakes. With a mix of price action, technical analysis, and awareness of market conditions, traders can filter out many fake signals before they commit.
False breakouts don’t appear only at support and resistance. They can occur along trend lines, channel edges, or even chart patterns such as triangles and head-and-shoulders. This is why context matters; price movements that look strong in isolation often lose credibility when checked against broader trending markets.
Price Action Signs
Charts reveal early warnings that a breakout might fail:
- Long wicks: If price breaks out but quickly rejects and closes back inside, the move is weak.
- Failed closes: Real trade breakouts usually hold beyond the level. Repeated failures to close are red flags.
- Engulfing or pin bars: These reversal candles show rejection of the level and hint at a failed attempt.
When you see these signals, the best course of action is to avoid entering. Patience often saves you from chasing unreliable price moves.
Multiple Timeframe Confirmation
Looking at only one chart can be misleading. A 15-minute chart might show a breakout, but zooming out to the 4-hour chart could reveal it as nothing more than a wick against the larger trend. Aligning short-term entries with higher timeframe market conditions ensures your breakout trading decisions fit the dominant structure.
Indicators and Tools
Technical analysis tools can provide extra confirmation:
- RSI divergence: If price breaks out but the RSI shows divergence (moving the opposite way), it signals a lack of strength. This often means the breakout will fail.
- MACD histogram: When the histogram shrinks during a breakout attempt, momentum is fading. Without strong momentum, the price move is unlikely to hold.
- Bollinger Bands: A reliable breakout usually pushes the bands wider. If they remain flat or contract, the breakout often collapses.
- ATR (Average True Range): Breakouts coming from low volatility (small ATR values) rarely last. The market needs energy behind the move to sustain it.
- ADX (Average Directional Index): Readings below 20 suggest weak trending markets. If there’s no trend strength, breakouts have a higher chance of failing.
Volume adds another layer. Breakouts without strong volume support rarely hold in real market conditions.
The more you learn and practice, the better you trade. That’s why Top One Trader combines expert education, a supportive trading community, and flexible funded accounts designed to help you reach your goals.
Join today and take the next step in building a stronger trading journey
How to Protect Yourself from a False Breakout
No trader avoids false breakouts forever. The key is limiting risk when price movements turn against you.
Use Stop Losses
Always place a stop loss just beyond the breakout point. If the price drops back inside the level, you exit before the losses grow. This approach keeps your trading capital safe when market conditions shift suddenly.
Strict Risk Management
Risk management is essential. Keep risk small, ideally no more than 0.5% to 1% of your account per trade. Breakout trading relies on probabilities, and protecting your account lets you survive the inevitable losing trades.
Confirmation Before Entry
If you haven’t entered yet, wait for proof. A strong candle supported by volume, or a retest that holds, is far more reliable than the initial push. By requiring confirmation, you filter out many weak breakout trades.
Avoid News-Driven Volatility
Breakouts that occur during major announcements are often unreliable. Sudden spikes may look like real price moves but quickly reverse. Professional traders often skip breakout trading during high-impact news and return once market conditions stabilize.
How to Take Advantage of a False Breakout
False breakouts often frustrate traders, but they can also provide some of the best opportunities in breakout trading. When price appears to break a key level but fails to hold, it leaves many traders trapped in losing positions.
Those trapped orders create momentum in the opposite direction, giving prepared traders a chance to profit. To understand how this works in practice, it’s important to look at the two most common types of failed breakouts: bull traps and bear traps.
Bull Traps and Bear Traps Explained
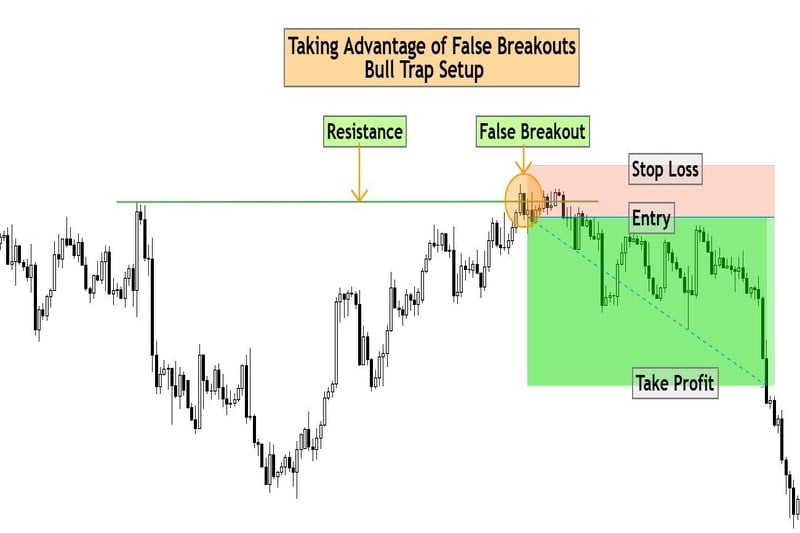
- Bull Trap: Price breaks above a resistance level, pulling traders into long positions, but then quickly reverses and closes back below resistance. This reversal often sparks strong downside momentum as buyers rush to exit.
- Bear Trap: Price dips below a support level, attracting short sellers, but then rebounds sharply and closes back above support. This sudden shift forces sellers to cover, driving prices upward.
These traps are reliable signals of a failed breakout and can be traded in the opposite direction once confirmed.
Trading the Reversal
The key to trading bull and bear traps is to enter as soon as the market shows clear rejection.
- Entry: Wait for a strong rejection candle at support in a bear trap or at resistance in a bull trap. Enter in the opposite direction once that candle closes.
- Stop Loss: Place your stop just beyond the false breakout point above the previous high in a bull trap or below the previous low in a bear trap. This protects you if the move continues.
- Target: Aim for the next key support or resistance level. A 1:2 or 1:3 risk-to-reward ratio is ideal, depending on market structure.
Practical Examples
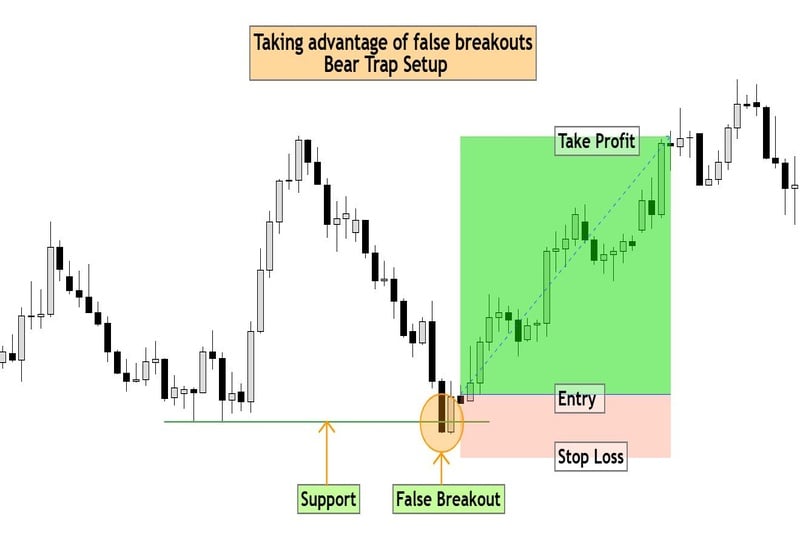
- Bear Trap Example:
In this chart, the price breaks below support and appears ready to continue lower. But the move quickly fails, and a bullish candle forms. A long entry above this candle with a stop just under the low sets up a trade targeting the next resistance, delivering a clean 1:3 risk-to-reward.
- Bull Trap Example:
In this chart, price pushes above resistance and tempts breakout buyers, only to reverse and close back under the level. A bearish rejection candle confirms the trap. A short entry below the rejection candle with a stop above the high, targeting the next support, offers a strong 1:3 risk-to-reward ratio.
Additional Confirmations
While price action provides the clearest signal of a bull or bear trap, extra confirmation helps validate both the false breakout and the direction of the move that follows:
- RSI divergence: If price breaks out but RSI moves in the opposite direction, momentum is weak and the breakout is likely false. This often confirms a bull trap when price rejects resistance, or a bear trap when price rejects support.
- Volume analysis: A reversal from support or resistance with strong volume can confirm the presence of a bull or bear trap.
- Multiple timeframe analysis: Higher timeframes confirm the dominant trend, while lower timeframe candlestick patterns provide precise entry confirmation. If the breakout fails against the higher-timeframe trend, it often signals the start of a bull or bear trap.
Final Thoughts
False breakouts are frustrating, but they don’t have to be costly. By recognising common causes such as liquidity grabs, news events, and timeframe conflicts, traders can avoid being trapped on the wrong side of the market. You can turn false breakouts into a profitable trading strategy by trading the opposite side using bull and bear traps.
Using price action, technical analysis, and confirmations like RSI, volume, and multi-timeframe analysis helps filter weak setups and validate traps. Combined with disciplined risk management, this approach allows traders to protect capital while turning false breakouts into high probability setups.
Join Top One Trader and apply your trading strategy on a funded account. Top One Trader gives you the platform, funding, and fast payouts you need to grow, backed by reliable rules and industry-leading support. Focus on your strategy, we’ll handle the rest.