
What Happens If You Blow a Funded Account?
Checked by the Top One Trader editorial team, experienced traders and analysts are committed to providing reliable, practical insights for funded trading success.
Blowing a funded account feels like a disaster, but most traders don’t understand why it happened or what they should do next. The truth is far less dramatic than it looks. Your journey isn’t over, and you’re not locked out of future opportunities. What matters now is understanding why the breach happened and how to protect your capital going forward.
In this guide, you’ll learn what blowing a funded account really means, what actually happens after a breach, and how to recover with a more structured and disciplined approach.
Key Takeaways
- Blowing a funded account simply removes your access to the firm’s capital. It happens when you hit a drawdown limit or violate one of the firm’s trading rules.
- Recovery is fully possible with the right discipline. Most prop firms allow traders to retry, and rebuilding starts with reviewing mistakes, correcting them, refining risk management, and following a structured trading plan.
What It Means to Blow a Funded Trading Account?
Prop trading has opened the door for thousands of retail traders to access trading capital they could never deploy on their own. A funded trading account gives you large capital to trade with, the freedom to execute your strategies, and the opportunity to earn a share of the profits. Yet the entire model relies on one fundamental condition: you must protect the capital you are given.
When a trader breaks the firm’s rules, reaches the maximum drawdown limit, which means losing more than the allowed risk per day or overall, or breaches other rules set by the prop firm, such as trading during high-impact news or using HFT high-frequency trading strategies, the funded account is considered blown or breached.
How Funded Accounts Work in Prop Trading?
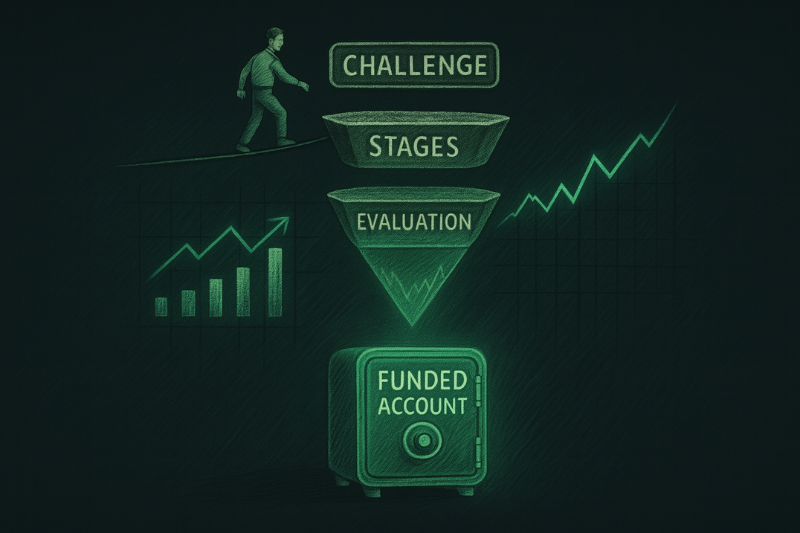
A funded trading journey starts by choosing the type of account you want. Most prop firms offer one-step evaluations, two-step evaluations, or instant funded accounts, and you select the capital size you wish to trade.
After choosing the account, the trader must understand the rules and objectives clearly. This includes knowing drawdown limits and any additional trading restrictions. Sticking to these rules is essential to avoid breaches.
The trader then enters the evaluation, which may be one or two phases. Each phase has a profit target expressed as a percentage that must be reached while respecting all the firm’s rules and risk limits. Passing the evaluation leads to a funded account, where the same rules still apply, and payouts are given based on the agreed profit split.
If a rule is broken, some firms send a warning, and repeated violations or hard rule breaches, such as exceeding a drawdown limit, will result in the account being breached and access to the capital being removed.
Drawdown Limits and Firm Rules You Must Respect
Every funded account operates under strict risk parameters. These rules vary slightly between proprietary trading firms, but they usually include:
- A maximum overall drawdown, often between eight and ten percent
- A daily loss limit, often between four and five percent
- Mandatory use of stop losses
- Restrictions on overnight or high-impact news trading in some firms
- Minimum trading days or activity requirements
- Consistent position sizing based on sound risk management
- Avoiding prohibited strategies in some firms, such as HFT or martingale approaches
Breaking any of these rules triggers an automatic breach. Even if the market later moves in your favour, a breach remains final. These rules exist to protect the firm’s capital and to ensure that traders maintain disciplined, responsible risk management at all times.
Ready to start your funded trading journey the right way?
If you want a programme built around clear rules, realistic drawdowns, and a fair evaluation process, explore Top One Trader’s challenges and choose the account type and capital size that fit your approach.
What Happens Immediately After You Blow the Account?
Blowing a funded account can feel dramatic, especially for newer prop traders. Some imagine large bills, hidden losses, or unexpected penalties. In truth, the consequences are far more straightforward.
Do You Owe Money to the Prop Firm?
This is the first question most traders ask, and the answer is almost always no. Legitimate proprietary trading firms do not require you to repay losses generated on a funded account. When you reach the maximum drawdown or violate a rule, the firm closes the account to prevent further losses. There is no personal financial liability, no debt, and no obligation to reimburse the firm.
If you passed the challenge and became funded, the worst outcome is losing your funded status, along with the time and effort you invested to earn it.
Losing Access to the Firm’s Capital
When you blow the account, the firm simply removes your access to the trading capital. Your login might be disabled, your account might be labelled as breached, or your funded dashboard might be reset.
This does not mean you are banned. Many prop trading programmes allow traders to attempt the challenge again, sometimes with an instant retry option. Your trading performance does not follow you from firm to firm, and your record of previously blown accounts is private between you and that specific firm.
Impact on Future Challenges and Re-Funding
Once the funded account is terminated, you typically have three options:
- Restart the challenge — many firms offer reduced-cost resets or complete free retries if you breached early.
- Purchase a fresh challenge — some traders choose to start again with a clean mindset.
- Pause and reassess — advisable for traders who blew their account due to emotional decision-making or a significant deviation from their trading plan.
Why Traders Lose Funded Accounts?
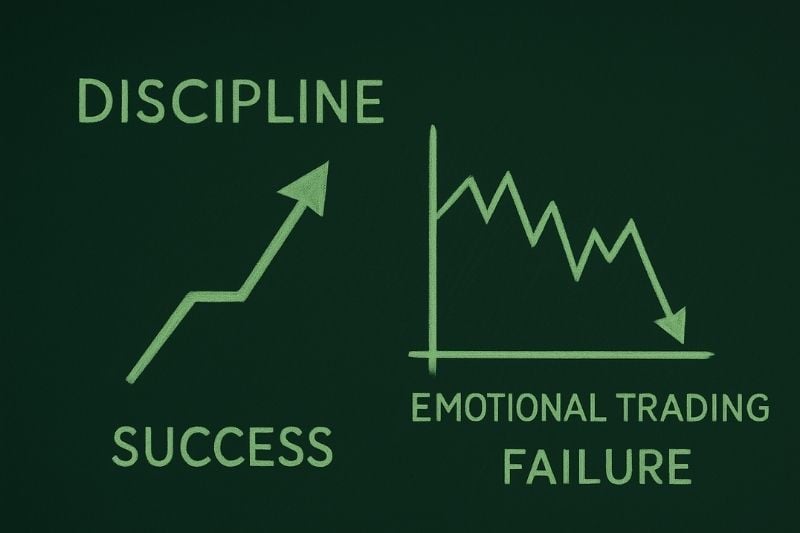
While many traders believe their situation is unique, the root causes behind blown funded accounts are almost always the same. Understanding these patterns is the first step to avoiding repeated breaches.
Poor Risk Management and Emotional Trading
Risk management is the foundation of funded trading. When traders fail to respect risk limits, everything else collapses. Common mistakes include risking too much per trade, increasing position size after a loss, stacking positions impulsively, widening stop losses, or letting losses run out of fear or denial.
Emotional trading amplifies these mistakes, especially after a losing streak or during volatile sessions. The urge to force setups or recover quickly is one of the strongest drivers behind blown funded accounts.
Ignoring Market Conditions
Not every market environment suits every strategy. Trend traders struggle in choppy phases, and range traders often get trapped in strong breakouts. Many traders blow accounts because they continue using the same approach even when market volatility or structure clearly does not support it.
Not Having a Real Edge
Some traders lose funded accounts simply because they do not have a proven edge. They rely on random setups, untested ideas, or strategies that look good in theory but fail in real market conditions. Without an edge that works consistently over time, even perfect discipline cannot save a funded account.
Lack of a Trading Plan or Journal
Without a trading plan, every setup becomes random and inconsistent. Without a journal, recurring mistakes remain hidden. Traders who do not track their behaviour and performance repeat the same errors until the account is breached.
Those who document and review their sessions build awareness, discipline, and long-term consistency.
The Real Reason Behind Most Breaches
Blowing a funded account is rarely about the market itself. It is almost always the trader’s behaviour, discipline, decision-making, and the strength of their edge. Even experienced traders lose accounts when they treat the firm’s capital differently from their own or fail to follow their rules.
How to Recover After Blowing a Funded Account?

Blowing a funded account may feel like a major setback, but it does not define your trading career. Real recovery comes from understanding what went wrong, calming your emotions, and rebuilding discipline through structured practice.
A Setback, Not the End
Many traders in the financial markets have lost funded accounts and later rebuilt stronger results through discipline, reflection, and a better understanding of prop trading. Recovery is not about rushing back into trading opportunities but identifying what went wrong and rebuilding with strict risk management rules.
Pause, Reset, and Review
After a breach, stop trading immediately and give emotions time to settle, as trading while frustrated leads to repeated mistakes. Once calm, review every trade taken before the breach and check whether you respected drawdown limits, followed your plan, adapted to market conditions, managed position size properly, and used logical stop losses.
Write everything in your journal, as journaling helps you see patterns clearly, learn from mistakes, limit risk, and grow as a trader.
Backtest, Build Your Edge, and Rebuild Discipline
After journaling, backtest your strategy to confirm whether it truly works across different markets, timeframes, and conditions. A trader without a proven edge cannot maintain a funded account long term, so focus on creating a clear strategy, testing it thoroughly, refining it, and trading it live with consistency.
Once you understand your mistakes and have validated your edge, spend one to two weeks on a demo account. Demo trading helps rebuild confidence and sharpen execution without risking another breach. Use fixed risk, consistent sizing, strict stop losses, and focus only on high-quality setups to reconnect with your process and discipline.
Strengthen Your Risk Management Framework
Funded accounts require strict risk management rules, so your own must be even tighter. Risk no more than 0.25 to 0.50 percent per trade, set a personal daily stop below the firm’s, and define clear criteria for valid setups and volatility adjustments. Traders who respect their rules consistently limit risk and avoid future breaches.
Best Practices to Protect Your Next Funded Account

| Best Practice | Why It Matters | How to Apply It |
| Know all the rules clearly | Prevents accidental breaches | Review drawdown, news rules, and minimum days |
| Use strict position sizing | Protects capital and mental state | Risk 0.25–0.50% per trade |
| Follow your trading plan | Builds consistency | Trade only setups that match your strategy |
| Journal your trades | Reveals repeated mistakes | Write down behaviour, setups, and results |
| Backtest your strategy | Builds a real edge | Test across markets and conditions |
| Avoid emotional trading | Reduces impulsive decisions | Stop trading after losses or stress |
| Trade in alignment with market conditions | Matches your strategy to the market | Adapt or stand aside in bad conditions |
Conclusion
Blowing a funded account is not the end of your trading journey. It is an opportunity to improve your trading skills, understand your mistakes, and strengthen your risk management techniques.
Trading always involves financial risk, but in prop trading, this risk is far lower than traders assume because you are not risking your own money.
Retail traders who stay disciplined, refine their strategy, and continue trading with a structured approach can protect their capital, limit risk, and turn future trading opportunities into long-term success.
Take the next step toward a successful trading career
Join Top One Trader and access reliable capital, transparent rules, fast payouts, and a structured environment designed for disciplined traders who want long-term success. You also gain access to ongoing educational content, market insights, and practical guidance to help you grow as a trader.
Dragon Pattern Trading: Identify and Trade Market Reversals
Checked by the Top One Trader editorial team, experienced traders and analysts are committed to providing reliable, practical insights for funded trading success.
Ever wonder how some traders seem to spot and trade market reversals without fear? Their secret often lies in recognising powerful chart patterns that reveal when momentum is shifting. One of the most effective is the Dragon Pattern, a rare but highly reliable reversal pattern that signals when momentum is changing. Named for its shape, the pattern blends structure and trader psychology, helping identify when markets are overextended.
In this Guide, you’ll learn how the dragon pattern trading setup forms, its key components, and how to trade both bullish and inverted dragons confidently across different markets.
Key Takeaway
- The Dragon Pattern is a rare but highly reliable reversal pattern that helps traders identify early signs of shifting momentum by blending technical structure with trader psychology.
- Mastering this dragon pattern trading setup allows you to recognise both bullish and bearish reversals, plan precise entries and exits, and trade with greater confidence and discipline.
What Is the Dragon Pattern in Trading?
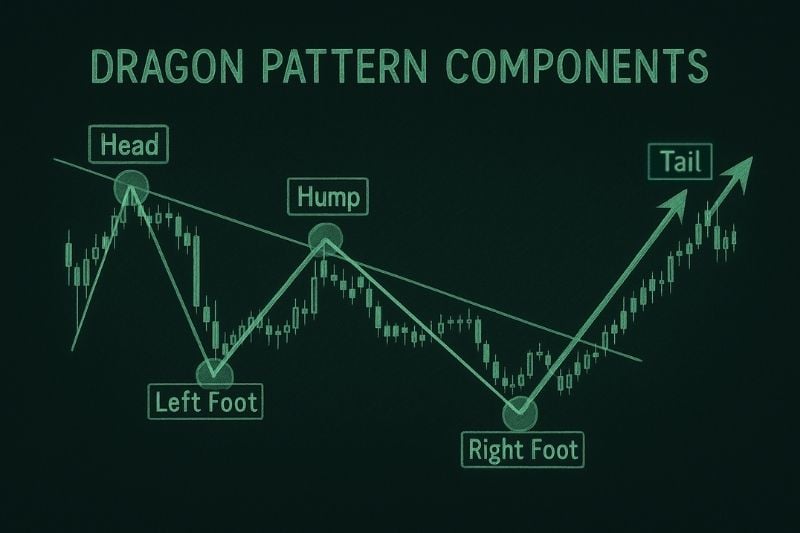
The Dragon Pattern is a price formation that signals a potential trend reversal after an extended move. Visually, it resembles a dragon lying across the chart with a head, two feet, a hump, and a rising tail that marks the breakout.
In a bullish dragon, the pattern appears after a downtrend. The market forms a sharp low known as the left foot, rebounds to a hump, tests a similar low again, forming the right foot, and then breaks higher through the hump line. In a bearish dragon, the structure is inverted.
Traders value this pattern because it is easy to recognise and often appears before significant reversals. It provides a structured approach for identifying exhaustion, planning entries, and setting targets when combined with supporting tools such as volume, RSI, momentum indicators, and candlestick patterns to confirm the setup.
Key Components of the Dragon Pattern
To trade the Dragon Pattern effectively, you must understand each part of its structure. The pattern consists of four main elements that together form its distinctive shape:
| Component | Description | Trading Insight |
| Head of the Dragon | The initial swing high in a bearish setup or swing low in a bullish setup marks the end of the previous trend and the start of a correction. | Signals trend exhaustion and the first sign that momentum may be shifting. |
| Feet – Left and Right | Two reaction points form the base of the pattern. The left foot forms first, followed by the hump, and then the right foot retests the same level. | Confirms strong support or resistance. Symmetry between both feet adds confidence to the setup. |
| Hump | The corrective leg between both feet that acts as the neckline or trendline. | A break above or below this level confirms the Dragon breakout and signals the start of a new move. |
| Tail | A final spike that indicates the pattern is complete. Sometimes the price extends beyond the feet, often caused by high volatility. | Represents an exhaustion followed by a brief correction or a possible reversal. It can act as a strategic level for taking partial or full profits. |
Types of Dragon Patterns
Bullish Dragon Pattern: Reversal from a Downtrend
The bullish dragon pattern emerges after a prolonged bearish move, marking the point where selling pressure weakens and buying strength begins to surface. It often signals the exhaustion of a downtrend and the early stages of a potential bullish reversal.
This pattern gives traders an opportunity to position early within a new upward phase, capitalising on a transition from weakness to strength. The most effective approach is to define entry and exit levels directly from the structure of the pattern itself, with targets often projected based on the height of the hump or the prior swing range.
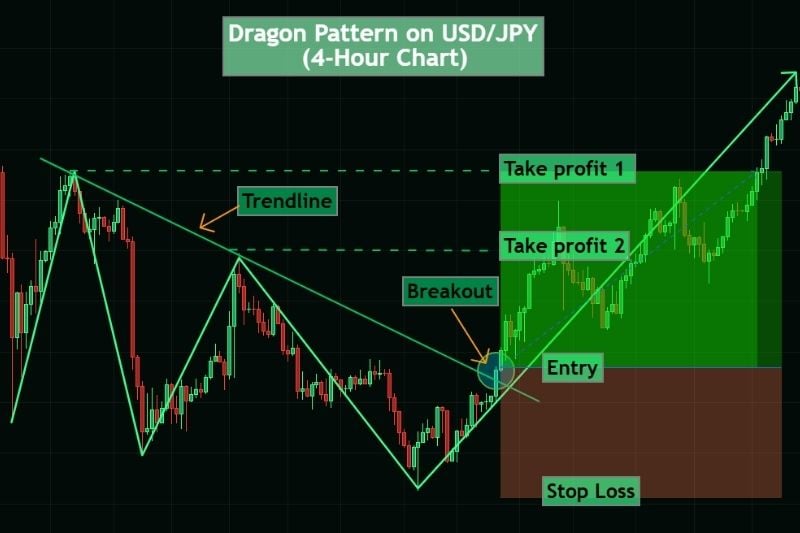
How to Trade the Bullish Dragon Pattern:
- Entry: After price breaks above the trendline, signalling renewed buying momentum.
- Stop Loss: Place it below the last low (right foot) to protect against losses. If the price moves below this level, the setup is considered invalid.
- Targets: The hump can serve as the first target, while the head can be used as the second target. Always aim for a positive risk-to-reward ratio to maintain consistency.
Ready to level up your trading journey?
Join Top One Trader and access expert educational content, transparent rules, and competitive challenge pricing. Learn, trade, and grow with a firm built for serious traders.
Bearish (Inverted) Dragon Pattern: Reversal from an Uptrend
The bearish dragon pattern, also known as the inverted dragon, is the opposite of the bullish setup. It develops after a sustained uptrend when buying pressure begins to fade and sellers gradually take control. This formation signals that the prevailing momentum is weakening and a downside reversal could be underway.
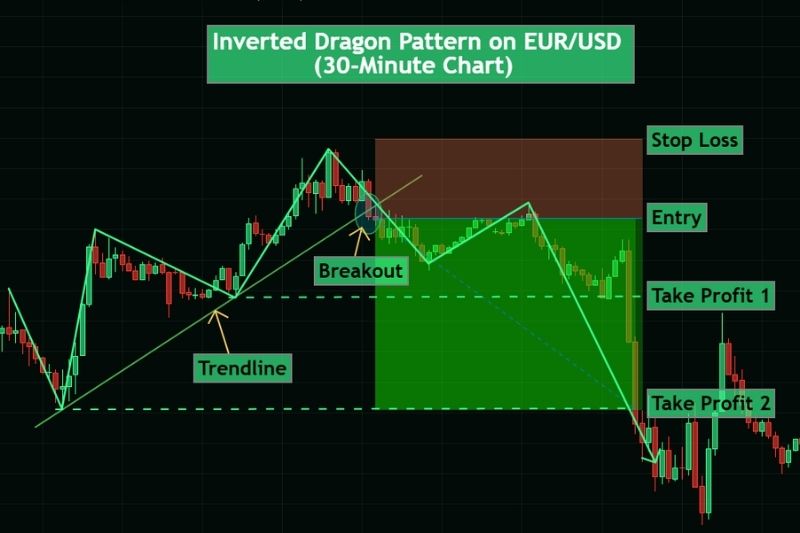
How to Trade the Bearish Dragon Pattern:
- Entry: Once price breaks decisively below the ascending trendline, indicating that buyers are losing control, and a bearish phase may start.
- Stop Loss: Set it just above the right foot to limit exposure in case of a false breakdown. A move beyond this level invalidates the setup.
- Targets: The first target can be projected from the hump area, while the second target extends toward the level of the initial swing (the head). Maintain a positive risk-to-reward ratio to keep your trades sustainable over time.
Identifying and Trading the Dragon Pattern with Confirmations
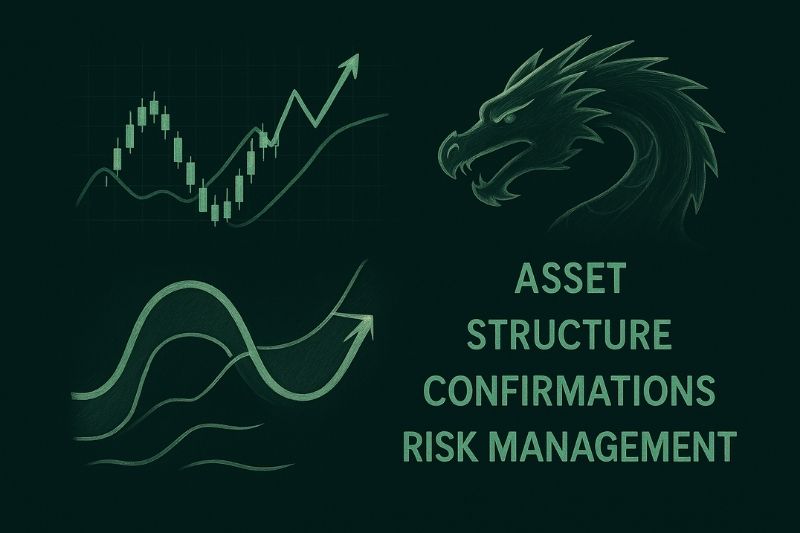
Spotting a Dragon on a live chart requires patience and precision. Many traders rush to call every double bottom a Dragon pattern, but the real setup shows balance, symmetry, and clear confirmation. It forms after a prior trend begins to weaken and signals a potential shift in market strength. The Dragon pattern rewards traders who combine technical skill with trading experience and structured risk control.
Asset
The Dragon pattern can appear across the forex market, cryptocurrencies, indices, stocks, and liquid commodities such as gold. It performs best in assets with steady liquidity and strong price swings, allowing traders to read the corrective movement clearly. Each market behaves differently, so backtesting helps identify where the setup performs best and which conditions favour its appearance.
Liquidity ensures that price swings form smoothly between the dragon’s key points. Volatile markets like gold or crypto create sharper legs that demand tighter management, while indices and stocks offer slower, steadier setups.
Timeframe
The Dragon adapts well to the 30-minute, 1-hour, 4-hour, and Daily charts. Intraday traders can find multiple setups per week, while swing traders gain a cleaner structure on higher timeframes. Combining perspectives improves accuracy, confirming the pattern on a higher chart and executing on a lower one for an ideal entry point.
Structure
A textbook Dragon resembles a double-bottom or double-top divided by a clear hump. The right foot forms near the left, and the head marks exhaustion of the prior trend. Smooth curves indicate a healthy corrective movement rather than random volatility. Patterns forming near major resistance levels or institutional supply and demand zones are stronger, as they align with natural shifts in order flow.
Confirmations
Confirmation separates skill from chance. Traders use multiple forms of evidence rather than relying solely on the visual shape:
• A decisive break of the neckline or trendline confirms structural change.
• A break and retest offers a conservative or long trade setup.
• Rising volume shows real market strength behind the move.
• Divergence on RSI or MACD suggests fading momentum.
• Alignment with resistance levels, supply or demand zones, or fundamental context such as sentiment or economic data.
• Agreement with other technical indicators, like moving averages or Fibonacci retracements, helps validate the pattern’s key features.
These signals vary depending on the market and timeframe, but combining several increases confidence in the setup.
Risk Management
Every Dragon setup must include defined entries, stops, and targets before execution. Aim for a positive risk-to-reward and keep position size consistent. If the breakout fails, the stop loss protects capital and leaves you ready for the next opportunity.
Confluence and Refinement
Accuracy improves when the pattern is supported by confluence tools:
• Fibonacci retracement levels can project targets.
• Moving averages confirm the broader direction.
• Trendline retests allow traders to join momentum without chasing price.
• Volume or order flow indicators highlight where participation builds.
Backtesting remains essential to identify where the Dragon performs most consistently. Review historical charts across different assets and timeframes, and combine technical analysis with awareness of fundamentals such as interest rates, economic data releases, and overall market sentiment to understand both price direction and context.
Mastering these elements turns the Dragon from a simple chart shape into a complete trading strategy grounded in technical precision, contextual awareness, and evidence-based execution.
Common Mistakes and Best Practices
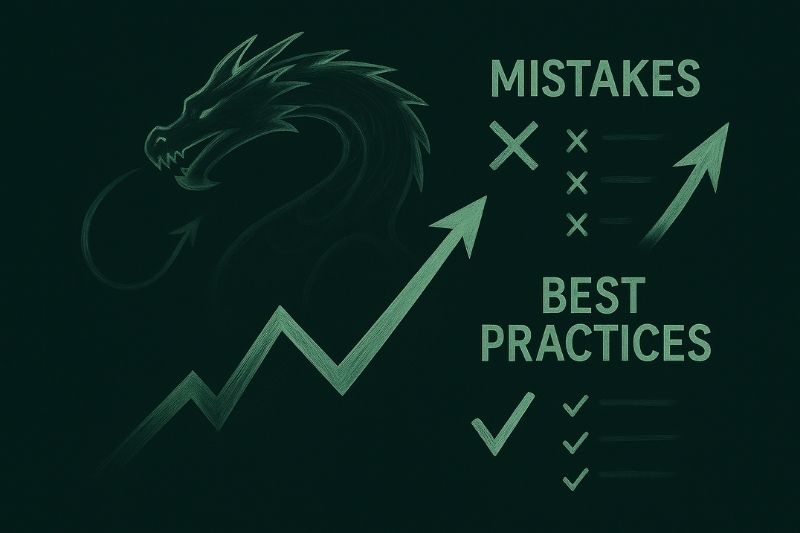
Even experienced traders misread the Dragon when emotions interfere. Recognising these pitfalls early protects both capital and confidence, especially for those building trading experience in the forex market. Understanding the structure and context helps filter weak setups and focus on the ones showing real market strength.
Common Mistakes
• Mistaking ordinary double bottoms or tops for Dragons. A valid setup must have proportion, a clear hump, and a defined structure that signals a genuine corrective movement, not a random pause in price action.
• Entering too early. Patience is key. Wait for the breakout and retest or for confirmation, such as RSI or MACD divergence, before taking your entry point. Acting too soon often traps traders before the potential shift completes.
• Ignoring volume or market context. Low liquidity or sudden economic releases can distort signals. Always check session timing and fundamental drivers before entering.
• Over-leveraging without a risk plan. Maintain consistent position sizing, respect your stop loss, and avoid assuming one long trade can recover prior losses.
Best Practices
• Validate the structure on multiple timeframes to confirm alignment with the broader trend.
• Record trades in a journal to track performance and identify recurring biases.
• Compare the Dragon with other technical indicators to understand its key features and limitations.
• Prioritise setups near major resistance levels or supply and demand zones for stronger confirmation.
• Focus on quality, not quantity. One precise setup with sound risk control is more effective than several uncertain opportunities.
By combining patience, awareness, and measured exposure, traders can apply the Dragon pattern within a structured strategy built for consistency and sustainable growth.
Final Thoughts
The Dragon Pattern reflects the balance between exhaustion and renewed strength in the market. When understood through solid technical analysis, it helps traders recognise when momentum fades and a potential reversal is forming.
The dragon pattern consists of clear structural elements that, when studied through practice, backtesting, and sound risk management, form the basis of an effective trading strategy across the forex market, indices, stocks, and crypto.
With discipline and patience, the Dragon becomes a framework for understanding market behaviour and price movement. Combined with confirmations, structure, and context, it guides traders toward better decisions, steadier performance, and the consistency needed for long-term profitability.
Join thousands of traders who trust Top One Trader!
Choose from flexible challenges, enjoy quick payouts, and get ongoing educational support. Your path to consistent trading starts here.