Checked by the Top One Trader editorial team, this article reflects the experience of traders and analysts committed to providing reliable, practical insights for funded trading success.
Have you ever wondered how traders recognise when a bearish trend is coming to an end and which areas are suitable for placing a long position as a bullish trend begins? There are many ways to identify these turning points using both technical and fundamental analysis.
One well-established chart pattern, often underestimated despite being used for decades, is the inverse head and shoulders pattern.
Commonly associated with bullish reversals after a sustained downtrend, this classic formation helps traders spot when selling pressure weakens and buying interest starts to return.
In this guide, we explain how the inverse head and shoulders pattern works, how to use it correctly to find high-probability setups, and how to apply it within a structured trading strategy.
Key Takeaways
- The inverse head and shoulders is a bullish reversal chart pattern that typically forms after a bearish trend, signalling a potential shift as selling pressure weakens and buyers regain control.
- Confirmation usually comes from a neckline breakout with a candle close above it, ideally supported by volume.
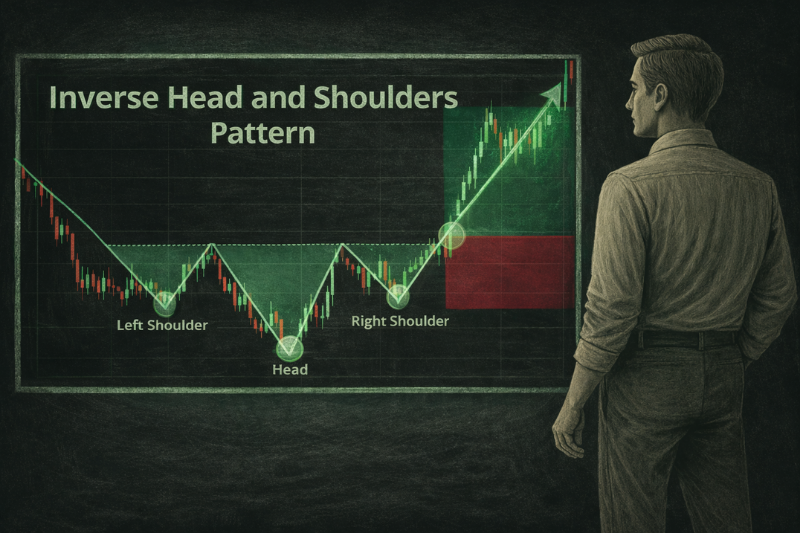
What Is the Inverse Head and Shoulders Pattern?
The inverse head-and-shoulders is a bullish reversal chart pattern used in technical analysis to identify potential trend changes after a sustained downtrend. It is characterised by three consecutive price lows, where the middle low is the deepest, and the two surrounding lows are higher and relatively similar.
This price formation reflects a progressive loss of bearish control. Each new decline attracts less selling pressure, while buying interest becomes more active, indicating that the market is starting to shift.
Its role is to identify a potential transition from bearish to bullish market conditions. When combined with other analyses, such as forming at a major support level or a demand zone, the pattern becomes more reliable.
Key Components of the Inverse Head and Shoulders Pattern
To trade the inverse head and shoulders pattern effectively, you must understand each part of its structure and how it forms. The pattern consists of several key components that together signal a potential reversal and provide a good trading opportunity.
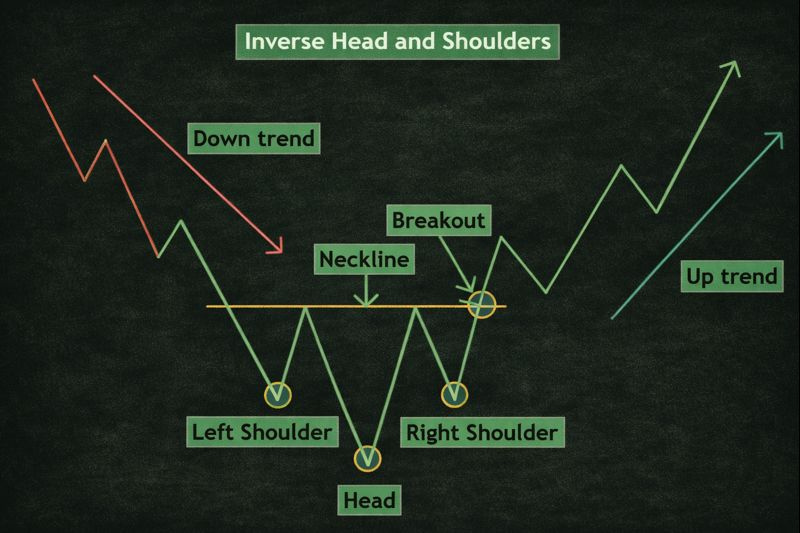
Left Shoulder
The left shoulder forms when the price declines and then rebounds, creating a temporary low. This bounce suggests early buying interest, but not enough to reverse the broader bearish trend.
Head formation
The head forms as price drops again to a deeper low than the left shoulder. This move often represents peak bearish sentiment. The stronger rebound that follows signals that selling pressure may be losing strength.
Right Shoulder
The right shoulder develops when price pulls back once more but fails to reach the depth of the head. This higher low indicates that sellers are no longer able to push prices down as aggressively, reinforcing the potential for a reversal.
Neckline
The neckline is drawn by connecting the highs of the rebounds between the shoulders and the head. It acts as a key resistance line. A confirmed break above the neckline is typically required to validate the pattern and signal a potential bullish reversal.
How Traders Use the Inverse Head and Shoulders Pattern
In live market conditions, the inverse head and shoulders pattern tends to appear after a prolonged downtrend, often near the point where selling pressure begins to fade, and buyers start to step in.
The pattern alone isn’t enough to act on, but when it forms around a major support level, demand zone, or a well-reacted price area, it becomes far more meaningful, as these zones often attract stronger market participation.
Rather than trying to pick the exact bottom, most experienced traders wait for the price to confirm the shift. A clean break above the neckline, with a solid close, helps show that momentum is turning in favour of buyers.
Volume can add extra confidence, but just as importantly, confirmation helps reduce the risk of false breakouts, where price briefly pushes higher only to fall back into the prior range.
Example of an inverse head and shoulders trade setup:
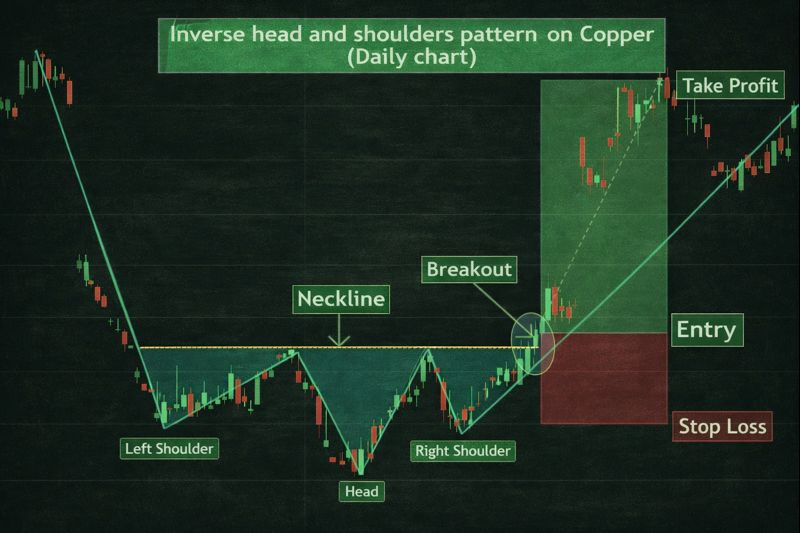
Entry
Once price breaks and closes above the neckline, it signals that buyers have gained strength and sellers have likely lost control.
- A more cautious entry waits for a retest of the neckline for confirmation.
- You can also combine this with volume and price action, for example, a breakout candle with high volume adds conviction.
Stop Loss
Place the stop loss just below the right shoulder. This protects your capital in case the pattern fails, and the price resumes downward.
Profit targets
There are two common approaches:
- Use a 1:2 risk-to-reward ratio based on your stop-loss placement.
- Or use multiple profit targets at key resistance levels, taking partial profits as the price reaches each one.
Ready to apply trading patterns in real market conditions?
Join Top One Trader and access flexible funded accounts, expert educational content, transparent rules, and a supportive trading community built to reward disciplined, serious traders.
A Practical Framework for Trading the Inverse Head and Shoulders

To improve consistency, the inverse head and shoulders pattern should be traded using a structured framework rather than visual recognition alone. This approach helps assess the pattern’s reliability, filter weak signals, and execute trades with greater confidence.
Asset
The inverse head and shoulders pattern can form across forex, indices, stocks, cryptocurrencies, and liquid commodities. It performs best in markets with strong liquidity, where price swings form cleanly, and breakouts are more reliable.
- Forex major pairs and major indices often produce clearer structures
- Highly illiquid assets increase noise and false signals
- Volatile markets require stricter confirmation and tighter risk control
Timeframe
The pattern works across all timeframes, but higher-timeframe formations are generally more reliable. They reflect broader shifts in market sentiment and are less affected by intraday noise.
- Higher timeframes provide cleaner structure and stronger signals
- Lower timeframes offer more setups but require added confirmation
- Many traders identify the pattern on a higher timeframe and refine entries on a lower one
Structure
A valid inverse head-and-shoulders pattern requires a clear, disciplined structure. The head must form the lowest point, and the right shoulder should be held above it, signalling weakening selling pressure.
High-quality structure includes:
- A clearly defined head and shoulders
- A right shoulder that fails to make a lower low
- A clean, logical neckline connecting key swing highs
Forcing the pattern onto unclear price action often leads to unreliable trades.
Confirmations
Confirmation helps separate high-probability setups from random chart formations. Traders typically wait for clear evidence that buyers have taken control, often confirming the inverse head-and-shoulders pattern with other technical indicators, price action, and volume.
Common confirmation signals include:
- A strong price action breakout, shown by a large bullish candle closing above the neckline and supported by increased volume
- A clean breakout followed by a retest of the neckline, confirming former resistance as new support
- Alignment with higher-timeframe support or demand zones
- Confirmation from momentum or strength indicators
When multiple confirmation factors align, the overall reliability of the setup improves.
Risk Management
Every inverse head-and-shoulders trade must have defined risk parameters before execution. Stops should be placed where the trade idea becomes invalid, not where losses feel uncomfortable.
Best practices include:
- Placing stop losses below the right shoulder
- Adjusting position size to maintain consistent risk
- Avoiding emotional decisions after losses
- Focusing on risk-to-reward rather than win rate
Confluence and Refinement
The pattern becomes more effective when supported by technical confluence. Confluence occurs when multiple technical factors point toward the same directional bias.
Useful confluence elements include:
- Higher-timeframe support or demand zones
- Moving averages align with the breakout
- Trendline breaks or retests near the neckline
- Fibonacci levels supporting targets or pullbacks
Backtesting and review are essential for refinement. Studying historical performance across assets and timeframes helps traders understand where inverse head-and-shoulders patterns perform best and how to adapt them to their trading style.
Common Mistakes and Best Practices
Although the inverse head-and-shoulders pattern is well known, it is often misused in real trading. Many failed setups are not caused by the pattern itself, but by execution errors, weak discipline, or unrealistic expectations. Understanding common mistakes and applying proven best practices helps traders improve consistency and avoid unnecessary losses over time.

Common Mistakes When Trading the Inverse Head and Shoulders
| Common Mistake | Why It Causes Problems |
| Entering before confirmation | Anticipating a neckline breakout often leads to early entries that are exposed to false moves. Without confirmation, traders are effectively guessing rather than reacting to validated market behaviour, which increases the likelihood of failed trades. |
| Ignoring volume behaviour | Breakouts that occur on weak or declining volume often lack participation from larger market players. Without sufficient volume, price may struggle to sustain the move, increasing the risk of sharp reversals back below the neckline. |
| Misidentifying structure | Not every three-low formation represents a valid inverse head and shoulders. Poor symmetry, shallow pullbacks, or unclear swing points often indicate random price movement rather than a meaningful shift in market control. |
| Poor stop-loss placement | Stops placed too tightly or without reference to the pattern’s structure often get triggered by normal price fluctuations. This leads to premature exits even when the broader setup remains technically valid. |
| Overconfidence in the pattern alone | Treating the inverse head and shoulders as a guaranteed reversal signal encourages traders to ignore the broader context. Without considering surrounding market conditions, even well-formed patterns can fail. |
These mistakes typically stem from impatience or over-reliance on the visual appearance of the pattern rather than disciplined execution.
Best Practices for Using the Pattern Effectively
| Best Practice | How It Improves Trade Quality |
| Wait for a confirmed neckline break | Waiting for a candle close above the neckline helps filter out weak breakouts and reduces exposure to false signals. This approach prioritises confirmation over anticipation. |
| Use volume as supporting confirmation | Increased volume during the breakout suggests stronger participation and improves confidence that the move is supported by genuine buying interest rather than short-term speculation. |
| Align with market context | When the pattern aligns with higher-timeframe structure, key support zones, or improving sentiment, it gains additional credibility. Context helps separate high-quality setups from average ones. |
| Apply structured risk management | Using logical stop placement and consistent position sizing ensures that no single trade can significantly damage trading capital, even if the setup fails. |
| Treat the pattern as part of a strategy | The inverse head and shoulders works best when combined with other tools rather than used in isolation. Integrating it into a broader trading plan improves consistency and decision-making. |
By focusing on disciplined execution rather than perfect prediction, traders can use the inverse head and shoulders pattern more effectively and with greater confidence.

The inverse head and shoulders chart pattern occurs after sustained bearish pressure and often signals a potential trend reversal pattern as selling momentum weakens.
When the right shoulder forms above the prior low and price approaches the breakout point, it reflects improving market sentiment and increasing buyer interest. A confirmed bullish breakout above the neckline helps validate the shift, offering traders a structured opportunity to enter a trade while expecting price rises as buying pressure strengthens.
However, the pattern should be combined with other technical analysis tools, including technical indicators, to strengthen its role within a broader trading strategy. This approach helps traders make more informed trading decisions while maintaining proper risk management.
When applied correctly within technical analysis, the inverse head and shoulders becomes a practical tool for identifying high-quality reversal opportunities while preserving discipline and risk awareness.
Become part of a trusted trading community at Top One Trader! Benefit from flexible challenges, fast payouts, advanced trading platforms, and ongoing education to support your trading journey.