
Inverse Head and Shoulders Pattern: A Practical Trading Guide
Checked by the Top One Trader editorial team, this article reflects the experience of traders and analysts committed to providing reliable, practical insights for funded trading success.
Have you ever wondered how traders recognise when a bearish trend is coming to an end and which areas are suitable for placing a long position as a bullish trend begins? There are many ways to identify these turning points using both technical and fundamental analysis.
One well-established chart pattern, often underestimated despite being used for decades, is the inverse head and shoulders pattern.
Commonly associated with bullish reversals after a sustained downtrend, this classic formation helps traders spot when selling pressure weakens and buying interest starts to return.
In this guide, we explain how the inverse head and shoulders pattern works, how to use it correctly to find high-probability setups, and how to apply it within a structured trading strategy.
Key Takeaways
- The inverse head and shoulders is a bullish reversal chart pattern that typically forms after a bearish trend, signalling a potential shift as selling pressure weakens and buyers regain control.
- Confirmation usually comes from a neckline breakout with a candle close above it, ideally supported by volume.
What Is the Inverse Head and Shoulders Pattern?
The inverse head-and-shoulders is a bullish reversal chart pattern used in technical analysis to identify potential trend changes after a sustained downtrend. It is characterised by three consecutive price lows, where the middle low is the deepest, and the two surrounding lows are higher and relatively similar.
This price formation reflects a progressive loss of bearish control. Each new decline attracts less selling pressure, while buying interest becomes more active, indicating that the market is starting to shift.
Its role is to identify a potential transition from bearish to bullish market conditions. When combined with other analyses, such as forming at a major support level or a demand zone, the pattern becomes more reliable.
Key Components of the Inverse Head and Shoulders Pattern
To trade the inverse head and shoulders pattern effectively, you must understand each part of its structure and how it forms. The pattern consists of several key components that together signal a potential reversal and provide a good trading opportunity.
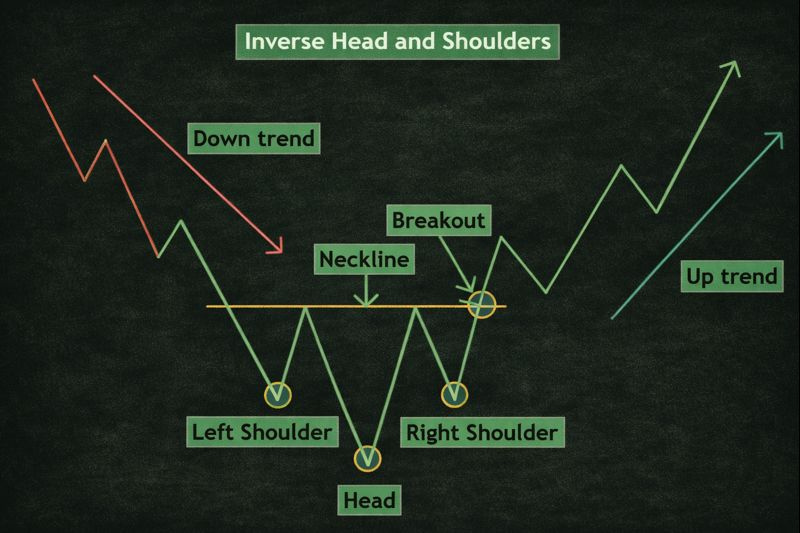
Left Shoulder
The left shoulder forms when the price declines and then rebounds, creating a temporary low. This bounce suggests early buying interest, but not enough to reverse the broader bearish trend.
Head formation
The head forms as price drops again to a deeper low than the left shoulder. This move often represents peak bearish sentiment. The stronger rebound that follows signals that selling pressure may be losing strength.
Right Shoulder
The right shoulder develops when price pulls back once more but fails to reach the depth of the head. This higher low indicates that sellers are no longer able to push prices down as aggressively, reinforcing the potential for a reversal.
Neckline
The neckline is drawn by connecting the highs of the rebounds between the shoulders and the head. It acts as a key resistance line. A confirmed break above the neckline is typically required to validate the pattern and signal a potential bullish reversal.
How Traders Use the Inverse Head and Shoulders Pattern
In live market conditions, the inverse head and shoulders pattern tends to appear after a prolonged downtrend, often near the point where selling pressure begins to fade, and buyers start to step in.
The pattern alone isn’t enough to act on, but when it forms around a major support level, demand zone, or a well-reacted price area, it becomes far more meaningful, as these zones often attract stronger market participation.
Rather than trying to pick the exact bottom, most experienced traders wait for the price to confirm the shift. A clean break above the neckline, with a solid close, helps show that momentum is turning in favour of buyers.
Volume can add extra confidence, but just as importantly, confirmation helps reduce the risk of false breakouts, where price briefly pushes higher only to fall back into the prior range.
Example of an inverse head and shoulders trade setup:
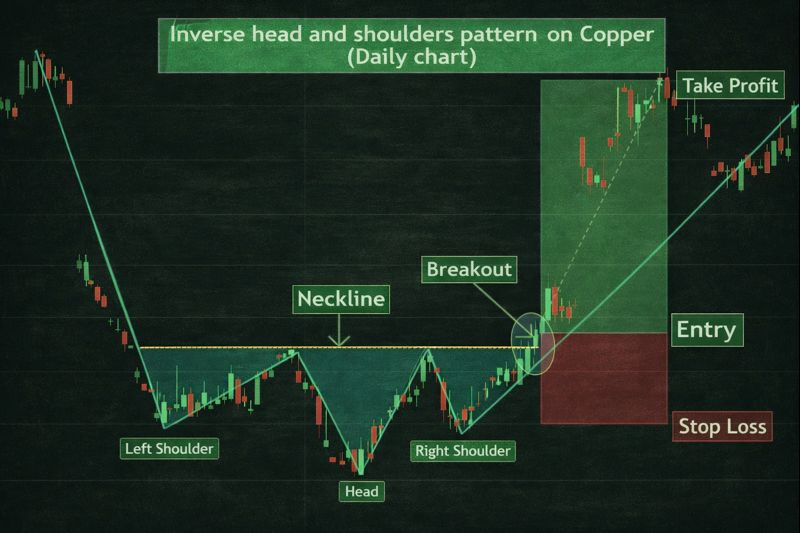
Entry
Once price breaks and closes above the neckline, it signals that buyers have gained strength and sellers have likely lost control.
- A more cautious entry waits for a retest of the neckline for confirmation.
- You can also combine this with volume and price action, for example, a breakout candle with high volume adds conviction.
Stop Loss
Place the stop loss just below the right shoulder. This protects your capital in case the pattern fails, and the price resumes downward.
Profit targets
There are two common approaches:
- Use a 1:2 risk-to-reward ratio based on your stop-loss placement.
- Or use multiple profit targets at key resistance levels, taking partial profits as the price reaches each one.
Ready to apply trading patterns in real market conditions?
Join Top One Trader and access flexible funded accounts, expert educational content, transparent rules, and a supportive trading community built to reward disciplined, serious traders.
A Practical Framework for Trading the Inverse Head and Shoulders

To improve consistency, the inverse head and shoulders pattern should be traded using a structured framework rather than visual recognition alone. This approach helps assess the pattern’s reliability, filter weak signals, and execute trades with greater confidence.
Asset
The inverse head and shoulders pattern can form across forex, indices, stocks, cryptocurrencies, and liquid commodities. It performs best in markets with strong liquidity, where price swings form cleanly, and breakouts are more reliable.
- Forex major pairs and major indices often produce clearer structures
- Highly illiquid assets increase noise and false signals
- Volatile markets require stricter confirmation and tighter risk control
Timeframe
The pattern works across all timeframes, but higher-timeframe formations are generally more reliable. They reflect broader shifts in market sentiment and are less affected by intraday noise.
- Higher timeframes provide cleaner structure and stronger signals
- Lower timeframes offer more setups but require added confirmation
- Many traders identify the pattern on a higher timeframe and refine entries on a lower one
Structure
A valid inverse head-and-shoulders pattern requires a clear, disciplined structure. The head must form the lowest point, and the right shoulder should be held above it, signalling weakening selling pressure.
High-quality structure includes:
- A clearly defined head and shoulders
- A right shoulder that fails to make a lower low
- A clean, logical neckline connecting key swing highs
Forcing the pattern onto unclear price action often leads to unreliable trades.
Confirmations
Confirmation helps separate high-probability setups from random chart formations. Traders typically wait for clear evidence that buyers have taken control, often confirming the inverse head-and-shoulders pattern with other technical indicators, price action, and volume.
Common confirmation signals include:
- A strong price action breakout, shown by a large bullish candle closing above the neckline and supported by increased volume
- A clean breakout followed by a retest of the neckline, confirming former resistance as new support
- Alignment with higher-timeframe support or demand zones
- Confirmation from momentum or strength indicators
When multiple confirmation factors align, the overall reliability of the setup improves.
Risk Management
Every inverse head-and-shoulders trade must have defined risk parameters before execution. Stops should be placed where the trade idea becomes invalid, not where losses feel uncomfortable.
Best practices include:
- Placing stop losses below the right shoulder
- Adjusting position size to maintain consistent risk
- Avoiding emotional decisions after losses
- Focusing on risk-to-reward rather than win rate
Confluence and Refinement
The pattern becomes more effective when supported by technical confluence. Confluence occurs when multiple technical factors point toward the same directional bias.
Useful confluence elements include:
- Higher-timeframe support or demand zones
- Moving averages align with the breakout
- Trendline breaks or retests near the neckline
- Fibonacci levels supporting targets or pullbacks
Backtesting and review are essential for refinement. Studying historical performance across assets and timeframes helps traders understand where inverse head-and-shoulders patterns perform best and how to adapt them to their trading style.
Common Mistakes and Best Practices
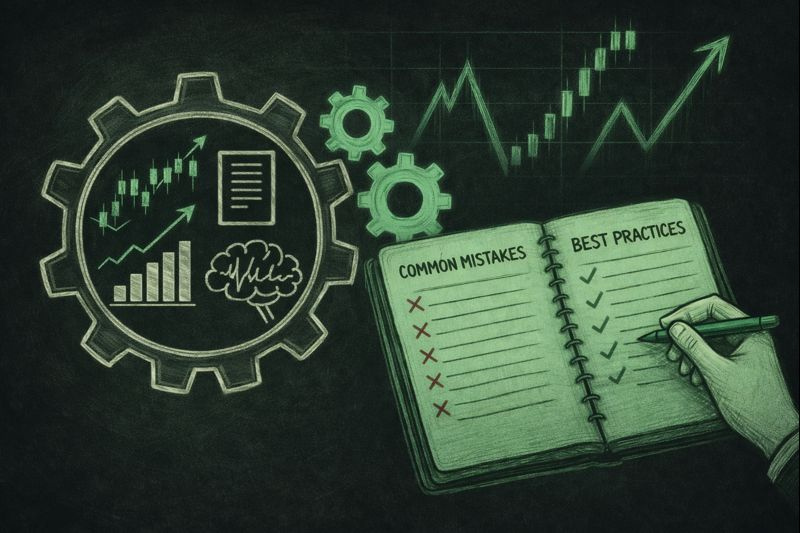
Although the inverse head-and-shoulders pattern is well known, it is often misused in real trading. Many failed setups are not caused by the pattern itself, but by execution errors, weak discipline, or unrealistic expectations. Understanding common mistakes and applying proven best practices helps traders improve consistency and avoid unnecessary losses over time.
Common Mistakes When Trading the Inverse Head and Shoulders
| Common Mistake | Why It Causes Problems |
| Entering before confirmation | Anticipating a neckline breakout often leads to early entries that are exposed to false moves. Without confirmation, traders are effectively guessing rather than reacting to validated market behaviour, which increases the likelihood of failed trades. |
| Ignoring volume behaviour | Breakouts that occur on weak or declining volume often lack participation from larger market players. Without sufficient volume, price may struggle to sustain the move, increasing the risk of sharp reversals back below the neckline. |
| Misidentifying structure | Not every three-low formation represents a valid inverse head and shoulders. Poor symmetry, shallow pullbacks, or unclear swing points often indicate random price movement rather than a meaningful shift in market control. |
| Poor stop-loss placement | Stops placed too tightly or without reference to the pattern’s structure often get triggered by normal price fluctuations. This leads to premature exits even when the broader setup remains technically valid. |
| Overconfidence in the pattern alone | Treating the inverse head and shoulders as a guaranteed reversal signal encourages traders to ignore the broader context. Without considering surrounding market conditions, even well-formed patterns can fail. |
These mistakes typically stem from impatience or over-reliance on the visual appearance of the pattern rather than disciplined execution.
Best Practices for Using the Pattern Effectively
| Best Practice | How It Improves Trade Quality |
| Wait for a confirmed neckline break | Waiting for a candle close above the neckline helps filter out weak breakouts and reduces exposure to false signals. This approach prioritises confirmation over anticipation. |
| Use volume as supporting confirmation | Increased volume during the breakout suggests stronger participation and improves confidence that the move is supported by genuine buying interest rather than short-term speculation. |
| Align with market context | When the pattern aligns with higher-timeframe structure, key support zones, or improving sentiment, it gains additional credibility. Context helps separate high-quality setups from average ones. |
| Apply structured risk management | Using logical stop placement and consistent position sizing ensures that no single trade can significantly damage trading capital, even if the setup fails. |
| Treat the pattern as part of a strategy | The inverse head and shoulders works best when combined with other tools rather than used in isolation. Integrating it into a broader trading plan improves consistency and decision-making. |
By focusing on disciplined execution rather than perfect prediction, traders can use the inverse head and shoulders pattern more effectively and with greater confidence.

The inverse head and shoulders chart pattern occurs after sustained bearish pressure and often signals a potential trend reversal pattern as selling momentum weakens.
When the right shoulder forms above the prior low and price approaches the breakout point, it reflects improving market sentiment and increasing buyer interest. A confirmed bullish breakout above the neckline helps validate the shift, offering traders a structured opportunity to enter a trade while expecting price rises as buying pressure strengthens.
However, the pattern should be combined with other technical analysis tools, including technical indicators, to strengthen its role within a broader trading strategy. This approach helps traders make more informed trading decisions while maintaining proper risk management.
When applied correctly within technical analysis, the inverse head and shoulders becomes a practical tool for identifying high-quality reversal opportunities while preserving discipline and risk awareness.
Become part of a trusted trading community at Top One Trader! Benefit from flexible challenges, fast payouts, advanced trading platforms, and ongoing education to support your trading journey.
Is Forex Trading Halal or Haram?
Checked by the Top One Trader editorial team, experienced traders and analysts are committed to providing reliable, practical insights for funded trading success.
Millions of people trade the forex market today, and many of them are Muslims who face the same recurring concern: Is forex trading halal or haram? The market offers real opportunities for traders, but not every trading practice aligns with Islamic principles.
Because of this, many Muslim traders feel confused or worried about whether participating in forex is religiously permissible.
This guide clears that confusion by explaining when forex becomes halal or haram and offering practical steps to help you trade in full alignment with Islamic guidelines.
Key Takeaways
- This article explains exactly when forex trading is considered halal or haram, using clear Islamic finance principles such as riba, gharar, and maisir, so Muslim traders can understand what is religiously permissible.
- You will learn how to trade forex in a fully halal way, including the conditions required, practical steps to stay compliant, and how to avoid trading practices that violate Islamic guidelines.
What Makes Forex Trading Halal or Haram? (Core Islamic Principles)

Understanding whether forex trading is halal or haram begins with the foundations of Islamic finance and sharia law. Islamic financial systems are built on fairness, transparency, and ethical conduct, ensuring that all transactions support legitimate value and avoid exploitation.
Three major prohibitions guide Islamic rulings on finance and trading:
1. Riba (Interest)
Riba refers to any guaranteed or automatic interest, and it is strictly forbidden.
In forex, this usually appears through:
- Overnight swap charges
- Interest-based rollover fees
- Earning or paying interest on leveraged positions
Most conventional forex accounts apply swaps when positions stay open overnight, making them non-compliant unless replaced with a swap-free Islamic account.
2. Gharar (Excessive Uncertainty)
Gharar occurs when a transaction involves ambiguity, unclear terms, or unknown outcomes.
In forex, gharar may appear in:
- Contracts without clear ownership
- Instruments with uncertain settlement timing
- Financial products based on unclear or unverifiable terms
High-risk speculative behaviour or unclear delivery also falls into this category.
3. Maisir (Gambling / Pure Speculation)
Maisir refers to activities where the outcome depends largely on chance instead of skill or analysis.
In forex, this includes:
- Extremely high-leverage trading
- Random, impulsive trading with no analysis
- Binary options and similar speculative products that function like price wagers rather than real trading
Islamic scholars consider such behaviour impermissible because it resembles gambling.
Ready to put your trading knowledge into practice?
Trade with Top One Trader and access a trusted funding programme built for serious traders. Get transparent rules, fast payouts, and a supportive trading environment as you work towards consistency.
Is Forex Trading Halal?
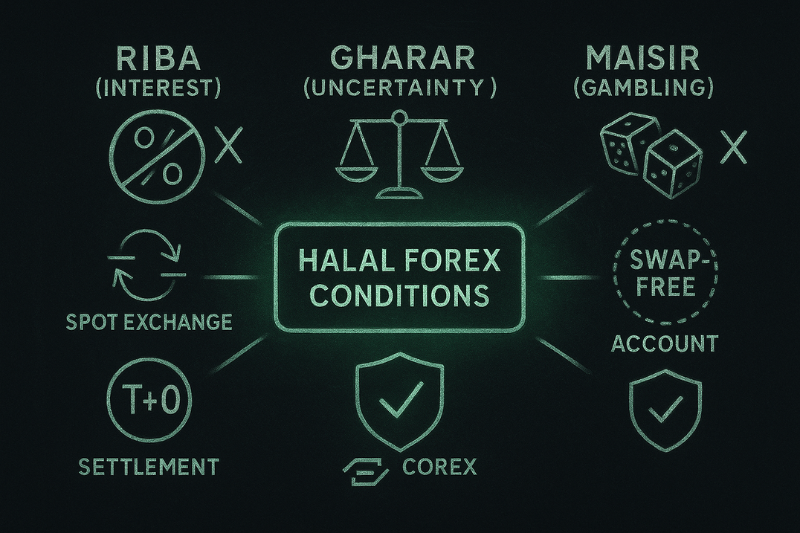
Forex trading can be halal — but only when it meets specific Islamic requirements. When FX trading follows Sharia conditions such as immediate exchange, fairness, and the absence of interest, it becomes a permissible form of currency exchange rather than speculation. When FX trading meets Islamic requirements, it aligns with the principles of ṣarf (currency exchange) recognised in Islamic jurisprudence, allowing Muslim traders to participate without compromising their beliefs.
To be considered halal, a forex transaction must follow Islamic criteria:
1. Spot trading with immediate exchange (T+0)
Forex becomes halal when currencies are exchanged instantly at the moment of trade. This fulfils the Islamic “hand-to-hand” requirement for ṣarf, ensuring no delay or uncertainty. Immediate settlement keeps the transaction transparent and compliant.
2. No interest of any kind (no swap fees)
Islam strictly prohibits riba, meaning no trader can pay or receive interest. Swap-free Islamic accounts remove overnight fees so positions can be held without violating this rule. This ensures the transaction remains clean and fully sharia-compliant.
3. Transparent, fair contracts
All terms, pricing, spreads, and execution must be clear before the trade is opened. Hidden conditions create gharar, an unacceptable form of uncertainty in Islamic finance. Transparency ensures fairness and protects both sides of the transaction.
4. Underlying economic value
Trades should reflect real currency exposure rather than products with no actual ownership. Many brokers offer forex through CFDs, which are price-based contracts rather than true currency exchange. Because CFDs do not involve delivery or ownership, their permissibility must be assessed carefully under Islamic guidelines.
5. Responsible use of leverage
Leverage itself is not automatically haram; it becomes problematic only when:
- The broker charges interest on borrowed funds
- The leverage level creates Maisir-like, high-risk behaviour
- Losses can exceed reasonable limits
In Islamic accounts, leverage is generally structured without interest, allowing it to be used within disciplined, risk-managed boundaries.
6. Trading with analysis and structure, not gambling
Halal trading relies on skill, research, and a reliable trading strategy, not chance. Impulsive decisions or random entries constitute maisir and violate Islamic rules. A structured, analytical approach keeps trading ethical and compliant.
7. Using a verified Islamic trading account
A legitimate Islamic account removes swaps completely and avoids disguised interest charges. Its fee structure must be transparent and fully disclosed to the trader. This provides a safe foundation for participating in halal forex.
How Islamic Scholars View Forex Trading
Islamic finance scholars generally agree that forex trading becomes permissible when these conditions are met, particularly the prohibition of riba, immediate settlement, avoidance of excessive uncertainty, and the presence of real economic value. Some scholarly interpretations differ slightly, depending on how modern instruments are assessed.
When these requirements are met, forex trading aligns with recognised Islamic jurisprudence on currency exchange, enabling Muslim traders to participate with confidence and in accordance with their faith.
Is Forex Trading Haram?
Forex can be halal when structured correctly, but it becomes haram when FX violates Islamic principles through elements such as interest, excessive uncertainty, and speculation. The most common issue is the presence of overnight interest payments (swap fees). When a position is held past midnight, the trader earns or pays interest, creating a form of riba that is strictly prohibited in Islam.
Speculative Trading and Maisir
Forex may also become haram when trading resembles gambling rather than informed analysis. Impulsive entries, extreme risk-taking, or decisions driven by chance rather than strategy can fall under the category of maisir. Islam prohibits trading behaviour that is based on randomness rather than skill and structured planning.
Excessive Leverage Concerns
Another source of concern is the use of excessive leverage. In many traditional trading accounts, leverage involves borrowing funds from the broker, with or without explicit or implicit interest obligations. Even when interest is not directly charged, very high leverage introduces instability and excessive risk that contradict Islamic financial ethics.
Instruments with Unclear Ownership (CFDs)
Some financial instruments raise questions due to unclear ownership or settlement. CFDs and similar non-delivery contracts allow traders to speculate on price movements without owning the underlying currency. Because they lack actual delivery and may contain uncertainty in their structure, they are sometimes classified as gharar by Islamic scholars.
Situations Where Forex Is Considered Haram
Forex trading is generally regarded as haram when it includes:
- Holding positions that incur overnight interest
- Using leverage tied to interest-based borrowing
- Speculating with no economic purpose
- Trading contracts without clear ownership or delivery
Why This Matters for Muslim Traders
Understanding these prohibited elements helps Muslim traders recognise trading environments that may compromise Islamic values. By avoiding structures that include riba, gharar, or maisir, traders can maintain compliance with Islamic financial principles.
How to Trade Forex the Halal Way (Practical Guidance + Checklist)
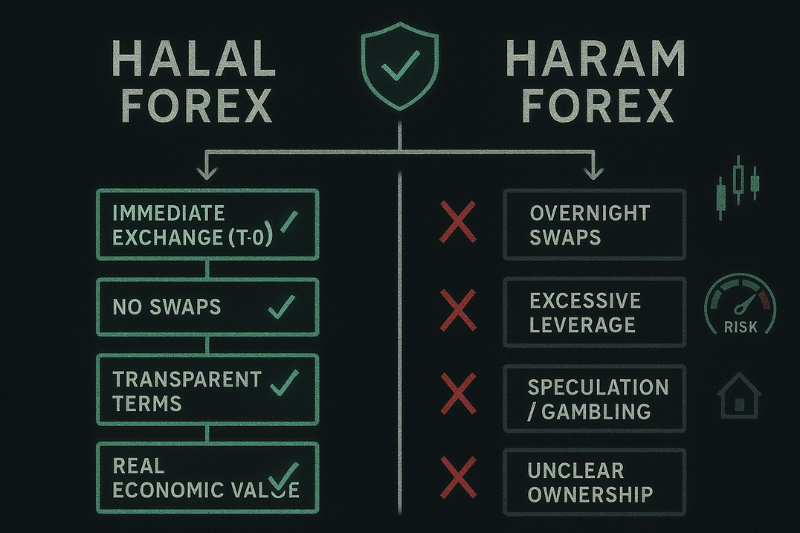
Trading forex in a halal manner requires more than avoiding swaps; it means ensuring your entire trading environment aligns with Islamic principles. Muslim traders should avoid riba, minimise gharar, and avoid practices that resemble maisir. These guidelines matter because forex is part of the broader financial markets, where many financial transactions may unintentionally conflict with Islamic law. A structured approach helps traders remain compliant while maintaining professional discipline.
1. Choose a Broker or Prop Firm Offering Verified Islamic Accounts
Select a regulated broker or a prop firm that provides transparent, interest-free Islamic trading account options. A compliant account must eliminate swaps, offer clear pricing, and avoid speculative incentives such as risky bonuses.
2. Open a Proper Swap-Free Account
Confirm that the account removes overnight interest without replacing it with disguised fees. Some accounts marketed as “Islamic” reintroduce hidden charges or limit swap-free status to a few days, which is not acceptable.
3. Trade Using Halal Strategies
Spot trading, day trading, and swing trading can all be halal when based on genuine analysis, structured planning, and responsible risk management. Avoid random speculation or high-risk decisions.
4. Apply Islamic Rules on Leverage and Settlement
Use leverage cautiously, only when no interest is involved. All currency exchanges should follow the T+0 (hand-to-hand) settlement principle to avoid gharar.
Quick Guide: What a True Islamic Account Should Look Like
| Requirement | Halal Islamic Account | Non-Compliant Account |
| Interest (Riba) | No swaps, no interest | Hidden fees acting like interest |
| Settlement (Ṣarf) | Immediate exchange (T+0) | Unclear or delayed settlement |
| Fee Transparency | Clear, fixed, disclosed | Variable or unclear charges |
| Speculation Incentives | None | Bonuses encouraging risky trading |
| Sharia Oversight | Sometimes scholar-reviewed | No religious verification |
Halal Trading Checklist
- No interest-based charges
- Clear contract terms with no hidden fees
- Real economic exposure, not purely synthetic speculation
- Swap-free structure confirmed in writing
- Disciplined, analysis-based trading behaviour
By following these guidelines, Muslim traders can participate confidently in the financial markets while staying fully aligned with Islamic ethical principles and maintaining a trading style grounded in discipline and clarity under Islamic law.
Final Thoughts
Forex trading can be practised in a fully halal way, but long-term success depends on more than avoiding interest or meeting Islamic conditions. Consistent profitability comes from disciplined execution, strong risk management, and a well-defined strategy with a real trading edge, not speculation or chance.
When traders focus on thoughtful analysis, responsible position sizing, and continuous improvement, they build habits that honour both Islamic principles and professional trading standards. By combining ethical compliance with a structured, skill-based approach, Muslim traders can pursue financial growth while staying true to their values.
Take the next step in your trading journey!Join Top One Trader and access flexible accounts, transparent rules, fast payouts, and educational content designed to support your growth. With everything you need in one place, you can focus on improving your trading and building long-term consistency.
What Happens If You Blow a Funded Account?
Checked by the Top One Trader editorial team, experienced traders and analysts are committed to providing reliable, practical insights for funded trading success.
Blowing a funded account feels like a disaster, but most traders don’t understand why it happened or what they should do next. The truth is far less dramatic than it looks. Your journey isn’t over, and you’re not locked out of future opportunities. What matters now is understanding why the breach happened and how to protect your capital going forward.
In this guide, you’ll learn what blowing a funded account really means, what actually happens after a breach, and how to recover with a more structured and disciplined approach.
Key Takeaways
- Blowing a funded account simply removes your access to the firm’s capital. It happens when you hit a drawdown limit or violate one of the firm’s trading rules.
- Recovery is fully possible with the right discipline. Most prop firms allow traders to retry, and rebuilding starts with reviewing mistakes, correcting them, refining risk management, and following a structured trading plan.
What It Means to Blow a Funded Trading Account?
Prop trading has opened the door for thousands of retail traders to access trading capital they could never deploy on their own. A funded trading account gives you large capital to trade with, the freedom to execute your strategies, and the opportunity to earn a share of the profits. Yet the entire model relies on one fundamental condition: you must protect the capital you are given.
When a trader breaks the firm’s rules, reaches the maximum drawdown limit, which means losing more than the allowed risk per day or overall, or breaches other rules set by the prop firm, such as trading during high-impact news or using HFT high-frequency trading strategies, the funded account is considered blown or breached.
How Funded Accounts Work in Prop Trading?
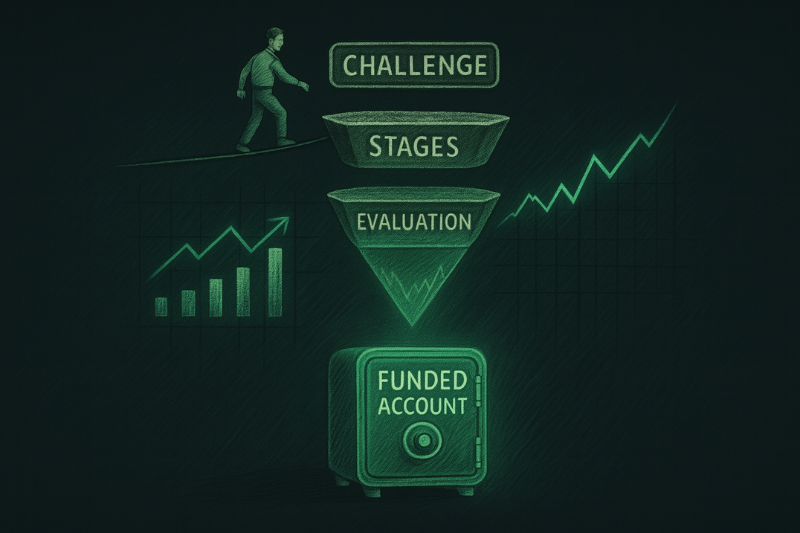
A funded trading journey starts by choosing the type of account you want. Most prop firms offer one-step evaluations, two-step evaluations, or instant funded accounts, and you select the capital size you wish to trade.
After choosing the account, the trader must understand the rules and objectives clearly. This includes knowing drawdown limits and any additional trading restrictions. Sticking to these rules is essential to avoid breaches.
The trader then enters the evaluation, which may be one or two phases. Each phase has a profit target expressed as a percentage that must be reached while respecting all the firm’s rules and risk limits. Passing the evaluation leads to a funded account, where the same rules still apply, and payouts are given based on the agreed profit split.
If a rule is broken, some firms send a warning, and repeated violations or hard rule breaches, such as exceeding a drawdown limit, will result in the account being breached and access to the capital being removed.
Drawdown Limits and Firm Rules You Must Respect
Every funded account operates under strict risk parameters. These rules vary slightly between proprietary trading firms, but they usually include:
- A maximum overall drawdown, often between eight and ten percent
- A daily loss limit, often between four and five percent
- Mandatory use of stop losses
- Restrictions on overnight or high-impact news trading in some firms
- Minimum trading days or activity requirements
- Consistent position sizing based on sound risk management
- Avoiding prohibited strategies in some firms, such as HFT or martingale approaches
Breaking any of these rules triggers an automatic breach. Even if the market later moves in your favour, a breach remains final. These rules exist to protect the firm’s capital and to ensure that traders maintain disciplined, responsible risk management at all times.
Ready to start your funded trading journey the right way?
If you want a programme built around clear rules, realistic drawdowns, and a fair evaluation process, explore Top One Trader’s challenges and choose the account type and capital size that fit your approach.
What Happens Immediately After You Blow the Account?
Blowing a funded account can feel dramatic, especially for newer prop traders. Some imagine large bills, hidden losses, or unexpected penalties. In truth, the consequences are far more straightforward.
Do You Owe Money to the Prop Firm?
This is the first question most traders ask, and the answer is almost always no. Legitimate proprietary trading firms do not require you to repay losses generated on a funded account. When you reach the maximum drawdown or violate a rule, the firm closes the account to prevent further losses. There is no personal financial liability, no debt, and no obligation to reimburse the firm.
If you passed the challenge and became funded, the worst outcome is losing your funded status, along with the time and effort you invested to earn it.
Losing Access to the Firm’s Capital
When you blow the account, the firm simply removes your access to the trading capital. Your login might be disabled, your account might be labelled as breached, or your funded dashboard might be reset.
This does not mean you are banned. Many prop trading programmes allow traders to attempt the challenge again, sometimes with an instant retry option. Your trading performance does not follow you from firm to firm, and your record of previously blown accounts is private between you and that specific firm.
Impact on Future Challenges and Re-Funding
Once the funded account is terminated, you typically have three options:
- Restart the challenge — many firms offer reduced-cost resets or complete free retries if you breached early.
- Purchase a fresh challenge — some traders choose to start again with a clean mindset.
- Pause and reassess — advisable for traders who blew their account due to emotional decision-making or a significant deviation from their trading plan.
Why Traders Lose Funded Accounts?
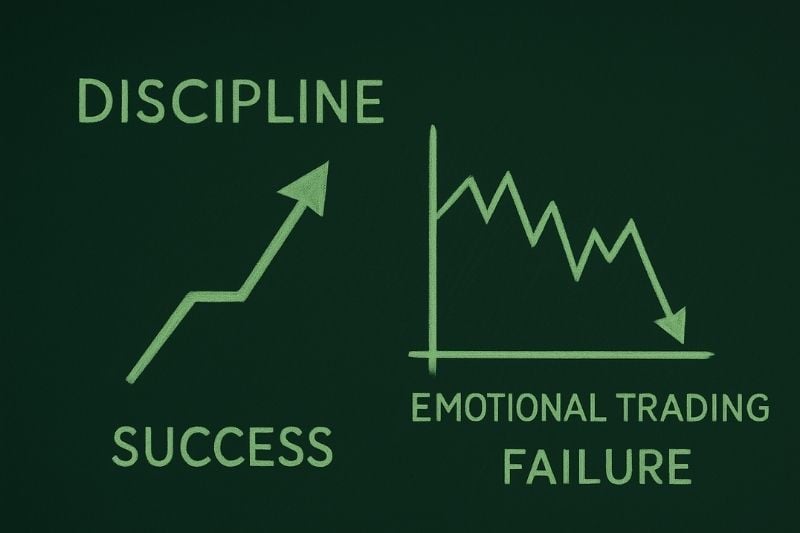
While many traders believe their situation is unique, the root causes behind blown funded accounts are almost always the same. Understanding these patterns is the first step to avoiding repeated breaches.
Poor Risk Management and Emotional Trading
Risk management is the foundation of funded trading. When traders fail to respect risk limits, everything else collapses. Common mistakes include risking too much per trade, increasing position size after a loss, stacking positions impulsively, widening stop losses, or letting losses run out of fear or denial.
Emotional trading amplifies these mistakes, especially after a losing streak or during volatile sessions. The urge to force setups or recover quickly is one of the strongest drivers behind blown funded accounts.
Ignoring Market Conditions
Not every market environment suits every strategy. Trend traders struggle in choppy phases, and range traders often get trapped in strong breakouts. Many traders blow accounts because they continue using the same approach even when market volatility or structure clearly does not support it.
Not Having a Real Edge
Some traders lose funded accounts simply because they do not have a proven edge. They rely on random setups, untested ideas, or strategies that look good in theory but fail in real market conditions. Without an edge that works consistently over time, even perfect discipline cannot save a funded account.
Lack of a Trading Plan or Journal
Without a trading plan, every setup becomes random and inconsistent. Without a journal, recurring mistakes remain hidden. Traders who do not track their behaviour and performance repeat the same errors until the account is breached.
Those who document and review their sessions build awareness, discipline, and long-term consistency.
The Real Reason Behind Most Breaches
Blowing a funded account is rarely about the market itself. It is almost always the trader’s behaviour, discipline, decision-making, and the strength of their edge. Even experienced traders lose accounts when they treat the firm’s capital differently from their own or fail to follow their rules.
How to Recover After Blowing a Funded Account?

Blowing a funded account may feel like a major setback, but it does not define your trading career. Real recovery comes from understanding what went wrong, calming your emotions, and rebuilding discipline through structured practice.
A Setback, Not the End
Many traders in the financial markets have lost funded accounts and later rebuilt stronger results through discipline, reflection, and a better understanding of prop trading. Recovery is not about rushing back into trading opportunities but identifying what went wrong and rebuilding with strict risk management rules.
Pause, Reset, and Review
After a breach, stop trading immediately and give emotions time to settle, as trading while frustrated leads to repeated mistakes. Once calm, review every trade taken before the breach and check whether you respected drawdown limits, followed your plan, adapted to market conditions, managed position size properly, and used logical stop losses.
Write everything in your journal, as journaling helps you see patterns clearly, learn from mistakes, limit risk, and grow as a trader.
Backtest, Build Your Edge, and Rebuild Discipline
After journaling, backtest your strategy to confirm whether it truly works across different markets, timeframes, and conditions. A trader without a proven edge cannot maintain a funded account long term, so focus on creating a clear strategy, testing it thoroughly, refining it, and trading it live with consistency.
Once you understand your mistakes and have validated your edge, spend one to two weeks on a demo account. Demo trading helps rebuild confidence and sharpen execution without risking another breach. Use fixed risk, consistent sizing, strict stop losses, and focus only on high-quality setups to reconnect with your process and discipline.
Strengthen Your Risk Management Framework
Funded accounts require strict risk management rules, so your own must be even tighter. Risk no more than 0.25 to 0.50 percent per trade, set a personal daily stop below the firm’s, and define clear criteria for valid setups and volatility adjustments. Traders who respect their rules consistently limit risk and avoid future breaches.
Best Practices to Protect Your Next Funded Account

| Best Practice | Why It Matters | How to Apply It |
| Know all the rules clearly | Prevents accidental breaches | Review drawdown, news rules, and minimum days |
| Use strict position sizing | Protects capital and mental state | Risk 0.25–0.50% per trade |
| Follow your trading plan | Builds consistency | Trade only setups that match your strategy |
| Journal your trades | Reveals repeated mistakes | Write down behaviour, setups, and results |
| Backtest your strategy | Builds a real edge | Test across markets and conditions |
| Avoid emotional trading | Reduces impulsive decisions | Stop trading after losses or stress |
| Trade in alignment with market conditions | Matches your strategy to the market | Adapt or stand aside in bad conditions |
Conclusion
Blowing a funded account is not the end of your trading journey. It is an opportunity to improve your trading skills, understand your mistakes, and strengthen your risk management techniques.
Trading always involves financial risk, but in prop trading, this risk is far lower than traders assume because you are not risking your own money.
Retail traders who stay disciplined, refine their strategy, and continue trading with a structured approach can protect their capital, limit risk, and turn future trading opportunities into long-term success.
Take the next step toward a successful trading career
Join Top One Trader and access reliable capital, transparent rules, fast payouts, and a structured environment designed for disciplined traders who want long-term success. You also gain access to ongoing educational content, market insights, and practical guidance to help you grow as a trader.
Dragon Pattern Trading: Identify and Trade Market Reversals
Checked by the Top One Trader editorial team, experienced traders and analysts are committed to providing reliable, practical insights for funded trading success.
Ever wonder how some traders seem to spot and trade market reversals without fear? Their secret often lies in recognising powerful chart patterns that reveal when momentum is shifting. One of the most effective is the Dragon Pattern, a rare but highly reliable reversal pattern that signals when momentum is changing. Named for its shape, the pattern blends structure and trader psychology, helping identify when markets are overextended.
In this Guide, you’ll learn how the dragon pattern trading setup forms, its key components, and how to trade both bullish and inverted dragons confidently across different markets.
Key Takeaway
- The Dragon Pattern is a rare but highly reliable reversal pattern that helps traders identify early signs of shifting momentum by blending technical structure with trader psychology.
- Mastering this dragon pattern trading setup allows you to recognise both bullish and bearish reversals, plan precise entries and exits, and trade with greater confidence and discipline.
What Is the Dragon Pattern in Trading?
The Dragon Pattern is a price formation that signals a potential trend reversal after an extended move. Visually, it resembles a dragon lying across the chart with a head, two feet, a hump, and a rising tail that marks the breakout.
In a bullish dragon, the pattern appears after a downtrend. The market forms a sharp low known as the left foot, rebounds to a hump, tests a similar low again, forming the right foot, and then breaks higher through the hump line. In a bearish dragon, the structure is inverted.
Traders value this pattern because it is easy to recognise and often appears before significant reversals. It provides a structured approach for identifying exhaustion, planning entries, and setting targets when combined with supporting tools such as volume, RSI, momentum indicators, and candlestick patterns to confirm the setup.
Key Components of the Dragon Pattern
To trade the Dragon Pattern effectively, you must understand each part of its structure. The pattern consists of four main elements that together form its distinctive shape:
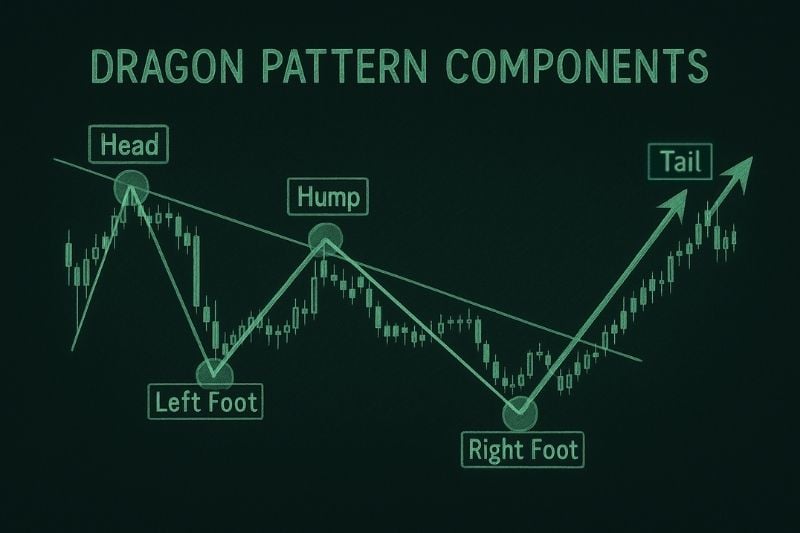
| Component | Description | Trading Insight |
| Head of the Dragon | The initial swing high in a bearish setup or swing low in a bullish setup marks the end of the previous trend and the start of a correction. | Signals trend exhaustion and the first sign that momentum may be shifting. |
| Feet – Left and Right | Two reaction points form the base of the pattern. The left foot forms first, followed by the hump, and then the right foot retests the same level. | Confirms strong support or resistance. Symmetry between both feet adds confidence to the setup. |
| Hump | The corrective leg between both feet that acts as the neckline or trendline. | A break above or below this level confirms the Dragon breakout and signals the start of a new move. |
| Tail | A final spike that indicates the pattern is complete. Sometimes the price extends beyond the feet, often caused by high volatility. | Represents an exhaustion followed by a brief correction or a possible reversal. It can act as a strategic level for taking partial or full profits. |
Types of Dragon Patterns
Bullish Dragon Pattern: Reversal from a Downtrend
The bullish dragon pattern emerges after a prolonged bearish move, marking the point where selling pressure weakens and buying strength begins to surface. It often signals the exhaustion of a downtrend and the early stages of a potential bullish reversal.
This pattern gives traders an opportunity to position early within a new upward phase, capitalising on a transition from weakness to strength. The most effective approach is to define entry and exit levels directly from the structure of the pattern itself, with targets often projected based on the height of the hump or the prior swing range.
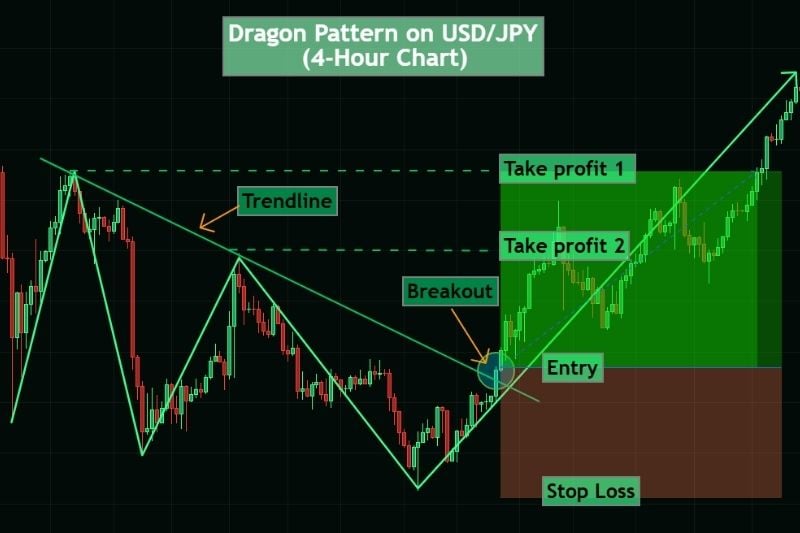
How to Trade the Bullish Dragon Pattern:
- Entry: After price breaks above the trendline, signalling renewed buying momentum.
- Stop Loss: Place it below the last low (right foot) to protect against losses. If the price moves below this level, the setup is considered invalid.
- Targets: The hump can serve as the first target, while the head can be used as the second target. Always aim for a positive risk-to-reward ratio to maintain consistency.
Ready to level up your trading journey?
Join Top One Trader and access expert educational content, transparent rules, and competitive challenge pricing. Learn, trade, and grow with a firm built for serious traders.
Bearish (Inverted) Dragon Pattern: Reversal from an Uptrend
The bearish dragon pattern, also known as the inverted dragon, is the opposite of the bullish setup. It develops after a sustained uptrend when buying pressure begins to fade and sellers gradually take control. This formation signals that the prevailing momentum is weakening and a downside reversal could be underway.
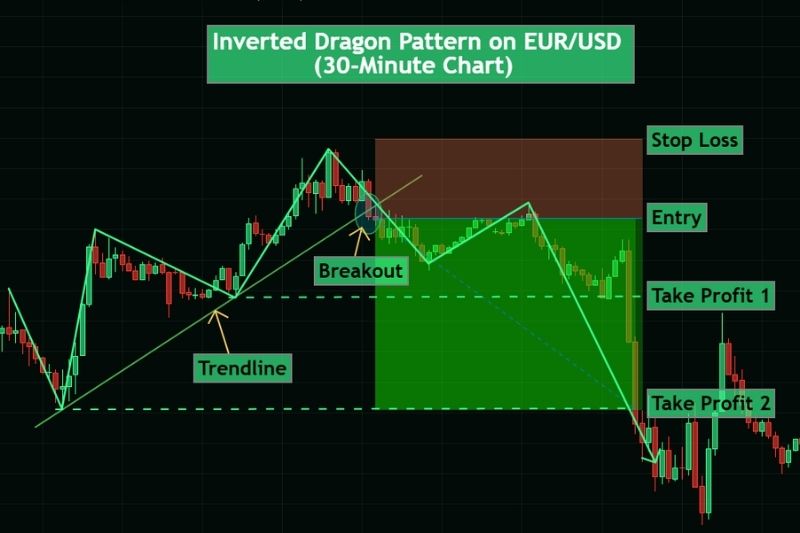
How to Trade the Bearish Dragon Pattern:
- Entry: Once price breaks decisively below the ascending trendline, indicating that buyers are losing control, and a bearish phase may start.
- Stop Loss: Set it just above the right foot to limit exposure in case of a false breakdown. A move beyond this level invalidates the setup.
- Targets: The first target can be projected from the hump area, while the second target extends toward the level of the initial swing (the head). Maintain a positive risk-to-reward ratio to keep your trades sustainable over time.
Identifying and Trading the Dragon Pattern with Confirmations
Spotting a Dragon on a live chart requires patience and precision. Many traders rush to call every double bottom a Dragon pattern, but the real setup shows balance, symmetry, and clear confirmation. It forms after a prior trend begins to weaken and signals a potential shift in market strength. The Dragon pattern rewards traders who combine technical skill with trading experience and structured risk control.
Asset
The Dragon pattern can appear across the forex market, cryptocurrencies, indices, stocks, and liquid commodities such as gold. It performs best in assets with steady liquidity and strong price swings, allowing traders to read the corrective movement clearly. Each market behaves differently, so backtesting helps identify where the setup performs best and which conditions favour its appearance.
Liquidity ensures that price swings form smoothly between the dragon’s key points. Volatile markets like gold or crypto create sharper legs that demand tighter management, while indices and stocks offer slower, steadier setups.
Timeframe
The Dragon adapts well to the 30-minute, 1-hour, 4-hour, and Daily charts. Intraday traders can find multiple setups per week, while swing traders gain a cleaner structure on higher timeframes. Combining perspectives improves accuracy, confirming the pattern on a higher chart and executing on a lower one for an ideal entry point.
Structure
A textbook Dragon resembles a double-bottom or double-top divided by a clear hump. The right foot forms near the left, and the head marks exhaustion of the prior trend. Smooth curves indicate a healthy corrective movement rather than random volatility. Patterns forming near major resistance levels or institutional supply and demand zones are stronger, as they align with natural shifts in order flow.
Confirmations
Confirmation separates skill from chance. Traders use multiple forms of evidence rather than relying solely on the visual shape:
• A decisive break of the neckline or trendline confirms structural change.
• A break and retest offers a conservative or long trade setup.
• Rising volume shows real market strength behind the move.
• Divergence on RSI or MACD suggests fading momentum.
• Alignment with resistance levels, supply or demand zones, or fundamental context such as sentiment or economic data.
• Agreement with other technical indicators, like moving averages or Fibonacci retracements, helps validate the pattern’s key features.
These signals vary depending on the market and timeframe, but combining several increases confidence in the setup.
Risk Management
Every Dragon setup must include defined entries, stops, and targets before execution. Aim for a positive risk-to-reward and keep position size consistent. If the breakout fails, the stop loss protects capital and leaves you ready for the next opportunity.
Confluence and Refinement
Accuracy improves when the pattern is supported by confluence tools:
• Fibonacci retracement levels can project targets.
• Moving averages confirm the broader direction.
• Trendline retests allow traders to join momentum without chasing price.
• Volume or order flow indicators highlight where participation builds.
Backtesting remains essential to identify where the Dragon performs most consistently. Review historical charts across different assets and timeframes, and combine technical analysis with awareness of fundamentals such as interest rates, economic data releases, and overall market sentiment to understand both price direction and context.
Mastering these elements turns the Dragon from a simple chart shape into a complete trading strategy grounded in technical precision, contextual awareness, and evidence-based execution.
Common Mistakes and Best Practices
Even experienced traders misread the Dragon when emotions interfere. Recognising these pitfalls early protects both capital and confidence, especially for those building trading experience in the forex market. Understanding the structure and context helps filter weak setups and focus on the ones showing real market strength.
Common Mistakes
• Mistaking ordinary double bottoms or tops for Dragons. A valid setup must have proportion, a clear hump, and a defined structure that signals a genuine corrective movement, not a random pause in price action.
• Entering too early. Patience is key. Wait for the breakout and retest or for confirmation, such as RSI or MACD divergence, before taking your entry point. Acting too soon often traps traders before the potential shift completes.
• Ignoring volume or market context. Low liquidity or sudden economic releases can distort signals. Always check session timing and fundamental drivers before entering.
• Over-leveraging without a risk plan. Maintain consistent position sizing, respect your stop loss, and avoid assuming one long trade can recover prior losses.
Best Practices
• Validate the structure on multiple timeframes to confirm alignment with the broader trend.
• Record trades in a journal to track performance and identify recurring biases.
• Compare the Dragon with other technical indicators to understand its key features and limitations.
• Prioritise setups near major resistance levels or supply and demand zones for stronger confirmation.
• Focus on quality, not quantity. One precise setup with sound risk control is more effective than several uncertain opportunities.
By combining patience, awareness, and measured exposure, traders can apply the Dragon pattern within a structured strategy built for consistency and sustainable growth.
Final Thoughts
The Dragon Pattern reflects the balance between exhaustion and renewed strength in the market. When understood through solid technical analysis, it helps traders recognise when momentum fades and a potential reversal is forming.
The dragon pattern consists of clear structural elements that, when studied through practice, backtesting, and sound risk management, form the basis of an effective trading strategy across the forex market, indices, stocks, and crypto.
With discipline and patience, the Dragon becomes a framework for understanding market behaviour and price movement. Combined with confirmations, structure, and context, it guides traders toward better decisions, steadier performance, and the consistency needed for long-term profitability.
Join thousands of traders who trust Top One Trader!
Choose from flexible challenges, enjoy quick payouts, and get ongoing educational support. Your path to consistent trading starts here.
Forex Trading Psychology: Building Consistency Through Mindset, Journaling, and Routine
Checked by the Top One Trader editorial team, experienced traders and analysts are committed to providing reliable, practical insights for funded trading success.
Trading success isn’t just about spotting the right setup; it is about how you think and react once you are in the trade. Two people can use the same strategy and still end up with completely different results. The real difference lies in mindset, discipline, and how you handle pressure.
In this guide, you will see why trading psychology matters, how successful traders stay consistent, and how habits like journaling and structured routines shape a stronger, more focused trading journey.
Key Takeaways
- Forex trading psychology is not about eliminating emotions; it’s about building systems that manage them so you can stay disciplined and follow your plan under pressure.
- Consistency comes from structured routines, journaling, and strict risk management that strengthen your mindset and support your trading journey.
Understanding Cognitive and Behavioral Biases in Forex Trading
Recency Bias
This bias makes traders overvalue recent events. After a few wins, confidence surges and position sizing grows. After a loss, hesitation takes over. In both cases, the trader abandons the plan and reacts emotionally.
Fix: Analyze at least 20–30 trades before drawing conclusions. Long-term averages, not the last few results. Stay consistent and stick to your trading plan.
Confirmation Bias
Confirmation bias makes traders focus only on information that supports their existing view while ignoring contradictory signs in the market. For example, a trader bullish on GBP/USD might search for positive forecasts and overlook technical signals of weakness.
Fix: Before entering any trade, write down one reason not to take it. This habit builds objectivity and helps you make more informed decisions based on logic, not emotion.
Loss Aversion
Losses feel roughly twice as painful as equivalent gains. Traders caught in this bias often move stop losses further away or hold on to a losing trade for too long, hoping the market will turn around. This behavior leads to significant losses and sometimes excessive risk-taking, especially when emotion overrides logic.
Fix: Set a predefined stop loss at a logical level that clearly invalidates your trading idea once the price reaches it, and never change it during the trade. Also, you can move it to the entry level (breakeven) when the price goes in your favor to protect your position in case the market reverses.
Outcome Bias
You judge your decision by the result, not the process. A random win reinforces a poor habit, while a disciplined trade that loses feels like failure.
Fix: Review trades based on rule-following, not profit. Successful traders rely on discipline, not luck, knowing that process-driven habits lead to better trading outcomes.
Actionable Checklist: Audit Your Own Bias
Review your last 20 trades, note moments of hesitation or emotion, and tag repeated biases in your journal
Managing Psychological Pressure in Prop-Firm Challenges
Challenge Phase Pressure and Profit Targets
Picture this. You are in a two-phase challenge, having cleared Phase 1 and needing just 1% more profit to get funded. The finish line is close, and psychology starts to take control. Many traders feel the urge to trade faster, increase lot sizes, or take poor setups to reach the goal. Profit targets create urgency that often turns a focused mindset into reckless behavior.
Fix: Slow down and focus on process over outcome. The challenge is not a race but a test of patience, discipline, and consistency. Set small objectives, such as 0.5% per session, instead of chasing the total target. Trust your plan, stay calm, and trade based on structure, not emotion. Prop firms reward consistency, not impulsive decision-making.
Drawdown Anxiety
During evaluation or funded stages, drawdowns trigger strong emotional reactions. Consecutive losses can cause stress or impulsive behavior. Some traders freeze, while others revenge-trade to recover quickly.
Fix: Accept that drawdowns happen to every trader. No method works all the time. What separates professionals is effective risk management. Use stop losses, limit daily and weekly risk, and size positions conservatively. In most prop-firm accounts, risking 0.25 to 0.50 percent per trade keeps your psychology intact and your capital protected.
Ready to trade in a professional environment that supports your growth?
Join Top One Trader and access powerful trading platforms, expert support, and educational content designed to sharpen your skills. Choose the challenge that fits your style and experience the difference of trading in a professional, supportive environment built for discipline and consistency.

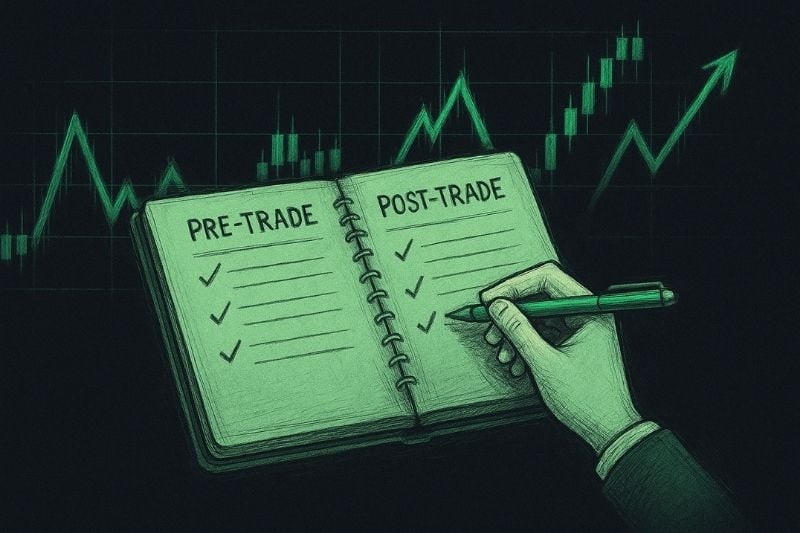
Pre-Trade and Post-Trade Routines
Discipline doesn’t come from motivation; it comes from repeatable structure. Pre- and post-trade routines help transform psychological control into measurable consistency. These routines turn trading into process management rather than emotional reaction.
Pre-Trade Preparation
Think of this as your warm-up before entering the market.
- Market Review: Scan major currency pairs, assessing market participants’ sentiment through both fundamentals and technical analysis.
- Position Sizing: Adjust exposure based on risk tolerance, session volatility, and recent performance.
- Focus Reset: Take 30–60 seconds to reset, stretch, breathe, or visualize your process.
- Intent Statement: Say aloud or note, “Today I follow process, not results.” It reinforces discipline through identity and awareness.
These steps ensure you enter each session calmly, ready to make informed decisions rather than act impulsively.
Post-Trade Review
After closing a trade, emotions peak whether it’s a win or a loss. Post-trade analysis helps separate logic from emotion.
- Emotional Rating: Score from 1 (calm) to 5 (tilted).
- Process Check: Did you follow your trading plan?
- Lesson Capture: Note one insight, such as “impatience before London opens.”
- Reset: Step away from charts for five minutes before reviewing again.
By keeping this structure, you turn psychological factors into data, improving clarity over time. Even three minutes of reflection each day can prevent cascading mistakes and strengthen your mental discipline.
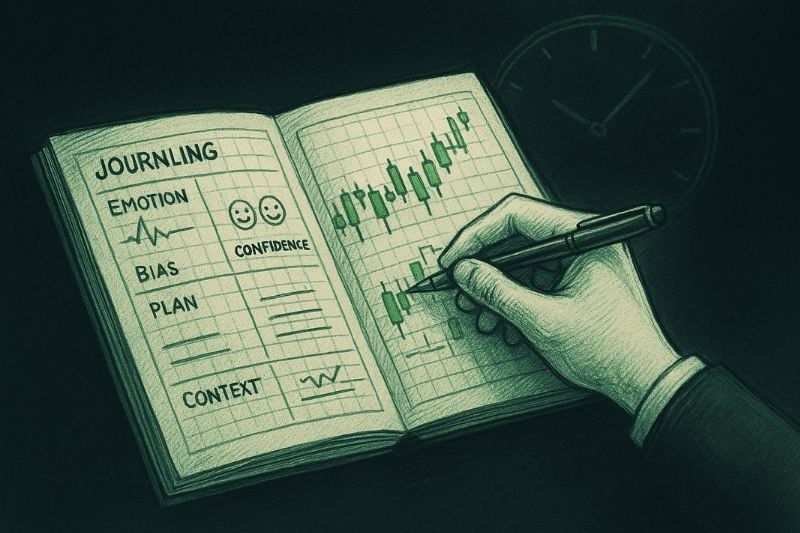
Journaling and Updating Your Trading Plan
What to Record
- Emotion tags: Fear, impulse, confidence, fatigue.
- Bias notes: Recency, confirmation, loss aversion.
- Plan adherence: Did you follow your strategy rules?
- Market context: Session, volatility, and structure.
Scoring System
Rate discipline instead of profit.
- 10/10: Perfect execution following plan.
- 7/10: Minor deviation.
- 5/10 or less: Major breach or emotional trading.
When reviewed weekly, this data shows where discipline slips and how risk management strategies can stabilize performance. Over time, you will start trading based on process rather than emotion, a defining habit of successful forex trading.
Weekly Review and Adjustment
Step back once a week to identify behavioral patterns.
- Do impulsive trades appear at specific hours?
- Does fatigue affect decisions near session close?
- Are losses larger after strong winning streaks?
From these insights, update your plan not only the technical trading strategy, but also the psychological rules. For example: “Avoid trading after three consecutive wins” or “Pause after midday if focus drops.” Journaling turns self-awareness into structure and process-driven growth.

Recovery Protocols After Losing Streaks
Every forex trading journey includes losing streaks. What separates professionals is how they respond. Emotional phases can distort rational thinking, increase stress, and lead to emotional trading.
Step Back Before Acting
When frustration builds, your ability to think clearly declines. Pause trading for 24–72 hours and reset your focus. Review your last ten trades without charts to identify recurring mistakes. This pause protects both your capital and your mindset, two pillars of solid risk management.
Identify Emotional Triggers
Losing streaks are often caused not by the system but by emotional responses to market volatility. Common triggers include:
- Fear of missing out → overtrading low-quality setups.
- Loss aversion → refusing to close bad trades.
- Recency bias → reducing size after one loss.
- Revenge trading → entering impulsively to win back losses.
Note these triggers in your trading journal and track them weekly. Awareness transforms reaction into data and control.
Rebuild Gradually
Avoid the temptation to win back losses quickly. Reduce position sizes and focus on execution.
| Phase | Objective | Risk per Trade | Things You May Do |
| Normal Trading | Strategy is performing well. Maintain consistency and confidence. | 0.5% | Continue following your trading plan, journal each trade, and track performance metrics. |
| Drawdown Period | Protect capital and manage emotions during a losing streak. | 0.25% | Reduce position size, take fewer trades, focus only on A+ setups, review strategy and execution, and avoid trying to recover losses quickly. |
| Recovery Phase | Rebuild gradually and regain rhythm after a drawdown. | 0.5% | Start small, maintain discipline, and focus on consistency before considering any increase in risk. |
This structure restores calm and improves trading performance while keeping your risk-reward ratio and risk tolerance consistent.
Reset Mind and Body
Mental fatigue affects decision quality as much as bad analysis. Prioritize rest, exercise, and hydration. Use short breathing sessions before the chart review. A clear mind is essential for consistent trading decisions.
Reflect, Learn, and Refine
Once composure returns, revisit your plan. Identify weak areas: patience, discipline, or analysis, and write one corrective rule, such as “Pause after three losses.” Successful traders understand that every losing phase is temporary, but lessons from it last a career.
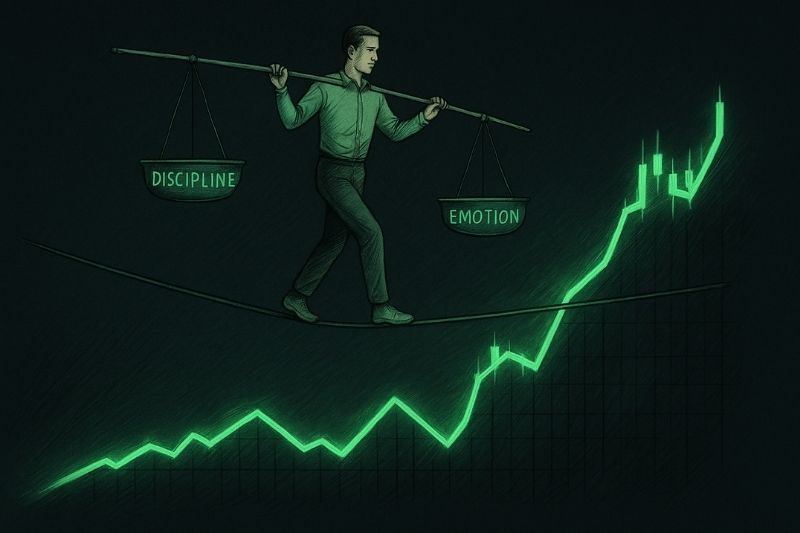
Developing the Professional Trader Mindset
A professional mindset in forex trading is built through repetition and structure, not motivation. Trading psychology refers to how your mindset, habits, and behavior influence every trade. Professionals approach markets like engineers, using data and risk management strategies to control behavior and optimize decisions.
| Trait | Description | Benefit |
| Detachment from outcomes | Viewing each trade as one of many | Prevents emotional trading |
| Thinking in probabilities | Focusing on the edge, not the single results | Encourages disciplined risk management |
| Commitment to improvement | Tracking emotional and performance metrics | Builds stability under market volatility |
| Continuous learning | Adapting to changing market conditions | Keeps confidence grounded in skill |
Professionals rely on structured habits to sustain consistent trading performance. They refine their trading strategy, align their risk-reward ratio with their risk tolerance, and make decisions based on logic, not emotion.
Daily Mindset Practices
- Begin the day with a 5-minute focus reset.
- Use the affirmation: “Follow process, not results.”
- After each session, rate emotional control from 1 to 5.
- End the week by updating your journal summary.
These small rituals transform mindset management into a measurable habit, the foundation of successful trading.
Conclusion
Trading psychology is not about removing emotion but managing it with structure and awareness. In forex trading, real progress comes from journaling, reviewing, and applying disciplined risk management strategies.
Successful traders understand that consistency and rational thinking define long-term success. They learn from mistakes, adapt to market volatility, and make calm, focused trading decisions.
When structure guides behavior and patience shapes process, successful forex trading becomes the natural result of emotional control and disciplined execution.
Take your trading psychology to the next level with Top One Trader.Get funded with up to $500,000, enjoy a transparent rules set, fast payouts, and a supportive community built for serious traders. With advanced tools, learning resources, and flexible challenges, you’ll have everything you need to turn consistency into long-term success.
Home Trading Setup: Build a Pro Desk for Better Focus
Checked by the Top One Trader editorial team, experienced traders and analysts are committed to providing reliable, practical insights for funded trading success.
Ever wonder why some traders remain calm and precise even during volatile market swings? Often, it’s not just their strategy; it’s their environment. A professional Home Trading Setup helps traders maintain focus, comfort, and efficiency, which directly impacts performance.
In this guide, you’ll learn how to build your own setup with the right desk, monitor configuration, reliable hardware, stable internet, and tools that support your trading journey.
Quick Overview
A Home Trading Setup is the foundation of every successful trader’s workspace. By combining a comfortable desk, multiple monitors, powerful hardware, and a stable internet connection, you can trade with better focus, comfort, and speed. Building the right environment isn’t just about aesthetics; it directly impacts decision-making, execution, and consistency.
Trading Desk and Workspace
Trading Desk
Your trading desk is one of the most important aspects of your home trading setup. It should be large enough to support multiple monitors and sturdy enough to handle the weight of your trading computers, stands, and other essential trading tools.
Many traders invest in a standing desk or height-adjustable option to alternate positions during long hours of day trading. Changing your position helps reduce fatigue, maintain focus, and create a more productive trading space. Keeping monitors at eye level with a proper monitor arm also improves comfort and posture during market hours.
Trading Chair
An ergonomic chair is just as essential to a perfect trading desk setup as your computer or monitors. Whether you choose a gaming chair or a professional office model, the key is proper lumbar support that keeps your back and neck comfortable during long trading sessions.
Small details like adjustable recline, soft cushioning, and comfortable arm supports can make a big difference when you’re focused on your charts, news feeds, and market data for hours.
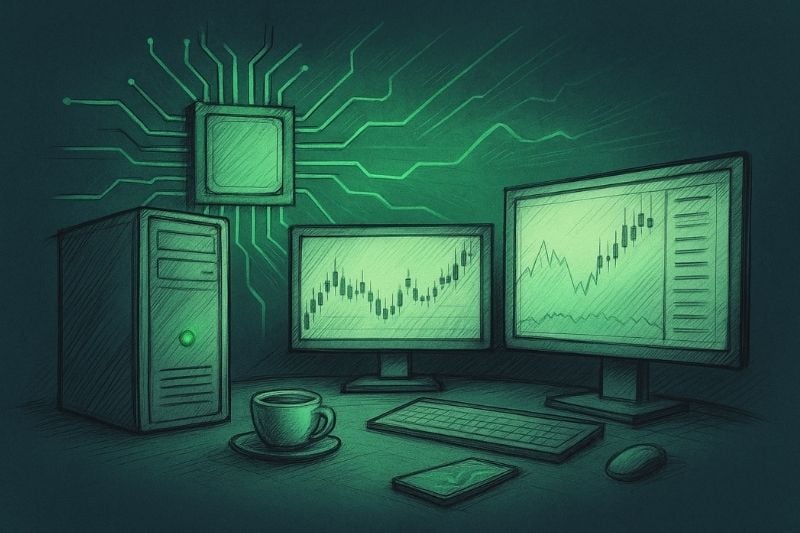
Trading Computers and Hardware
Desktop Computers
Desktops are the true power engines of trading. They deliver higher performance, better cooling, and far more upgrade flexibility than laptops, all crucial when you’re running several platforms, scanning multiple charts, and processing live data at once.
If you rely on algorithms or backtesting, a powerful desktop becomes essential. Handling large datasets and ensuring fast execution demand the extra CPU power, memory, and speed that only a desktop setup can provide.
Key specs to look for:
- Multi-core CPU for smooth multitasking.
- Dedicated GPU to handle multiple screens without lag.
- SSD for fast boot and quick data access.
- 16 to 32 GB of RAM is ideal, especially if you run heavy backtests or multiple trading programs at once.
- For the processor, an AMD Ryzen 7 (3700X or 6000 series) or an Intel i7 or i9 offers a great balance of power and efficiency.
If you’re into algorithmic trading or data-heavy analysis, consider upgrading your RAM and storage for smoother performance.
Recommended setups: an AMD Ryzen 7 (3700X or 6000 series) or Intel i7 or i9 is a solid starting point. Upgrade RAM and storage if you do algorithmic trading or data-heavy analysis.
Laptop for Trading
Not every trader wants to be tied to a desk. That’s where laptops come in. A laptop offers portability, making it easy to monitor trades on the go or use it as a backup when your main desktop isn’t available.
For trading, it’s best to avoid entry-level laptops. Instead, choose models that come with:
- A strong CPU and GPU to smoothly handle charts and multiple screens.
- Long battery life to keep your sessions uninterrupted.
- Fast SSD storage for quick, reliable platform performance.
The main advantage is flexibility; you can trade from your home office, a café, or even on the go without losing much power.
Quick tip: High-end options like the Dell XPS or MacBook Pro offer an ideal mix of performance and portability for active traders.
Monitor Setups for Trading
Your monitors are your window to the markets. A fast computer helps, but if you cannot see the right information at a glance, you still hesitate. Aim for a layout that shows charts, data and news without crowding the desk.
A large UHD monitor lets you park several charts or dashboards side by side. Many traders compare EUR/USD and GBP/USD in one view so they can spot small divergences and act a little quicker.
Example: LG 43″ UHD monitor.
Curved ultrawide monitors offer a panoramic sweep of price history. You see more candles in one glance, and the gentle curve often feels easier on the eyes during long sessions.
Example: Dell UltraSharp 49″ curved monitor.
A multi-monitor setup suits scalpers and day traders who track several markets and an order book at the same time. Two screens are enough for some people, while others feel comfortable with four or even six.
Horizontal screens can hold an economic calendar, a watchlist and the day’s headlines, leaving primary space for technical charts. It keeps you informed without clutter.
With a well-organized monitor setup, you notice context faster and decide with more confidence. That usually translates into cleaner entries and calmer trade management.
Ready to Take Your Trading to the Next Level? The right monitor setup gives you clarity, but real progress comes from skill, discipline, and support. Join Top One Trader to combine your setup with expert education, a strong community, and funded trading opportunities.

Internet and Connectivity
Nothing ruins a perfect setup like losing connection during a live trade. It is every trader’s nightmare. Even the best hardware means nothing without a fast, stable internet connection. A single lag spike or drop can cost real money, especially when you already have positions open and the market starts moving fast.
Aim for at least 100 Mbps high-speed internet, and always have a backup connection, such as a mobile hotspot or a second provider, in case of emergencies.
Connectivity also comes down to convenience. Power extensions and USB hubs make it easier to plug in multiple devices, charge accessories, and keep your desk organized. Combine that with good cable management, and your workspace stays clean and efficient.
The result is reliability. With the right internet setup and connectivity tools, you can execute trades smoothly, stay connected to the markets, and trade with confidence.
Trading Accessories
Once the core of your home trading setup is ready, the next step is fine-tuning it with accessories. These may seem secondary, but they often make the biggest difference in daily comfort and execution speed.
Input Devices
Your mouse and keyboard are the tools you touch the most during the day. An ergonomic design makes a huge difference when you are spending long hours in front of the screen. A regular office set can work, but gear made for professionals feels smoother, helps prevent wrist strain, and gives you better control.
It is a small change that pays off quickly. The easier it is to move around your trading platform, the more attention and energy you can give to real analysis and execution.
Trading Keypads
For traders who want to save every second, trading keypads are a powerful addition. Devices like the TradeMaster are designed with multiple programmable buttons for instant actions. Imagine being a scalper who needs to act fast. With a keypad, you can place a buy or sell, open stop or limit orders, set your lot size, and even place stop loss or take profit orders instantly.
Instead of scrolling through menus or clicking several times, the order is executed with a single tap. Some pads even allow you to preconfigure actions like 0.01, 0.05, 0.5, or 1 lot orders directly. This speeds up your workflow and helps avoid mistakes. The benefit is clear. Faster decisions, fewer errors, and smoother trade execution.
Monitor Supports and Cable Management
Once you start adding more screens and gear, things can get messy. That is when organization really matters. Monitor supports and adjustable arms help you move your screens to the perfect height so you can sit comfortably and avoid neck pain. They also clear some space on the desk, which always feels nice when everything else is fighting for room.
Cables, on the other hand, are the usual troublemakers. A bunch of tangled wires does not just look bad, it can mess with your focus. Simple tricks like using clips, trays, or built-in channels under the desk keep everything neat and out of sight. When the space around you looks clean and balanced, it is easier to think clearly and stay productive.
Software and Tools
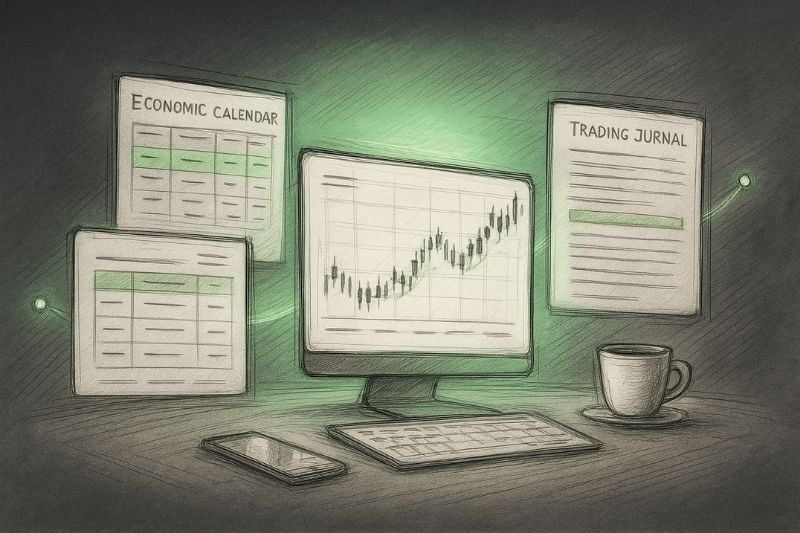
Even the best hardware setup is incomplete without the right software. Trading is as much about the tools on your screen as it is about the equipment on your desk.
Trading Platforms
Most traders rely on platforms such as MetaTrader 4 (MT4), MetaTrader 5 (MT5), Trade Locker and TradingView, along with broker or prop firm platforms. These are the gateways to the markets. MT4, MT5, and Trade Locker are excellent choices for executing trades, offering speed, stability, and advanced order management tools.
TradingView, on the other hand, is one of the best platforms for charting and technical analysis, thanks to its clean interface and wide range of indicators. Choosing the right platform depends on your trading style. For example, if you are a scalper, you need an advanced platform for fast order execution.
News Feeds and Economic Calendars
Charts tell part of the story, but the real moves often start with the news. A sudden rate decision, a jobs report, or a policy comment can shift the entire market in seconds. That’s why experienced traders keep one eye on their charts and the other on economic calendars.
Platforms such as MyFXBook, Forex Factory, or Investing.com make it easy to follow key events and data releases in real time. When you know what’s on the schedule, you’re better prepared to handle market volatility, plan your entries, and protect your trades before the market reacts.
Dashboards and Trading Journals
To trade like a professional, you need to analyze more than just price action. You must also analyze your own performance. Dashboards and trading journals are powerful tools for tracking metrics such as win rate, profit and loss, risk-to-reward ratios, and consistency over time.
Integrating dashboards with your trading journal lets you visualize your data clearly, helping you identify strengths, weaknesses, and behavioral patterns that affect results. Over time, this data-driven feedback loop becomes one of your biggest advantages in improving as a trader.
Position Size Calculators
Position size calculators ensure every trade aligns with your risk management plan. They help you calculate the correct lot size based on your account balance, stop loss distance, and risk percentage per trade. Using them consistently keeps your exposure under control and protects your capital from unnecessary losses.

Conclusion
A good trading setup is more than screens and hardware. It is the space where focus meets discipline. When everything around you works smoothly, your mind follows. But don’t forget, the real progress comes from learning and building your skills. Combine both, and you will start to see great results in your trading.
Start Building Your Trading Future. Your home trading setup is the first step toward professional success. Combine the right environment with skill, discipline, and support from Top One Trader to unlock your full potential.
Join today and trade with confidence, focus, and funding behind you.
Improve Your Trading Decisions with Trend Exhaustion Indicator
Checked by the Top One Trader editorial team, experienced traders and analysts are committed to providing reliable, practical insights for funded trading success.
Trend analysis is the heartbeat of every market. It guides traders in positioning their trades in the right direction, spotting opportunities, timing entries, and riding momentum for profits. But no trend lasts forever. At some point, momentum weakens and price begins to reverse or correct, often leading to unexpected losses.
This stage, known as trend exhaustion, can catch traders off guard if ignored. Recognising it not only helps avoid unnecessary losses but also uncovers valuable setups.
In this guide, we’ll break down what trend exhaustion is, how to identify it, and how the Trend Exhaustion Indicator can support smarter trading decisions.
Key Takeaway
- Trend exhaustion happens when buying or selling momentum fades, causing the price to stall, correct, or reverse direction.
- By combining price action, momentum indicators like RSI, and tools such as volume or supply and demand zones, traders can identify exhaustion more reliably.
- Using the Trend Exhaustion Indicator adds visual confirmation, helping traders avoid late entries, manage risk, and turn potential turning points into profitable opportunities.
What is Trend Exhaustion?
Trend exhaustion is the stage where a strong move begins to lose momentum. Buyers in an uptrend or sellers in a downtrend gradually run out of strength, and price struggles to push in the same direction. It doesn’t mean the trend ends instantly, but it signals the market may be close to a reversal or at least a corrective phase.
For traders, recognising this moment is crucial. Entering too late into a fading trend often results in small gains or unexpected losses when the price flips direction. By learning to spot trend exhaustion, you gain the ability to anticipate when the crowd is running out of conviction. This helps you avoid chasing moves and instead prepare for opportunities when the market changes. Just like every market cycle begins and grows, every cycle also weakens, and exhaustion is the natural sign that change is coming.
How to Identify Trend Exhaustion
Traders rely on a combination of tools and price action clues to confirm when a trend may be running out of steam.

- RSI (Relative Strength Index) and MFI (Money Flow Index):
These indicators can be used in two ways to spot exhaustion: first, by watching how they behave in overbought or oversold zones. If RSI or MFI enters an extreme level and then starts to revert, it can suggest that momentum is fading and a potential trend exhaustion is near.
Second, by looking for divergences between the price and the indicator. For example, if price forms a higher high in an uptrend while RSI or MFI forms a lower high in overbought territory, it highlights weakening momentum and warns that sellers may step in to drive price lower. - Volume:
Strong trends usually come with rising volume. If volume drops near a peak or bottom, it indicates the price is losing momentum and the trend is weakening. - Candlestick Rejections:
Strong rejection candles, such as pin bars, shooting stars, or hammers, forming against the prevailing trend often indicate exhaustion. In an uptrend, a large bearish rejection candle suggests sellers stepping in to drive prices lower. In a downtrend, a bullish rejection candle signals buyers are willing to push prices higher. - Moving Averages:
When price moves too far from a major moving average, it often signals stretched momentum and a likely correction. A decisive break of the average can indicate a potential pullback or even a trend reversal, while crossovers between short- and long-term averages confirm shifting strength. - Market Structure:
A change of character, when price breaks the last swing high in a downtrend or the last swing low in an uptrend, often signals that trend momentum is weakening and a potential reversal may follow. - Supply and Demand Zones:
Key resistance or support zones frequently act as exhaustion points where opposing orders absorb momentum, forcing the price to stall or reverse. - Chart Patterns:
Formations like double tops, double bottoms, cup and handle, or head-and-shoulders patterns are structural signs that a prevailing trend may be nearing exhaustion.
No single method is flawless. The key is combining these tools for confirmation. By layering price action, volume, and indicators, traders can build a clearer picture of when exhaustion is likely to occur and position themselves ahead of potential reversals.
Ready to put your strategies to the test? Trade in real markets and keep up to 90% of profits. Start your Top One Trader-funded account challenge today and prove your edge in the markets
Trend Exhaustion Indicator
The Trend Exhaustion Indicator was designed to simplify one of the hardest tasks in trading: recognising when a trend is about to lose steam. Instead of relying solely on instinct, it gives traders visual cues that highlight exhaustion points directly on the chart.
The indicator works by analysing a mix of price momentum, volatility, and patterns. When the market stretches too far in one direction, values plotted by the tool reach extreme levels, suggesting that buyers in an uptrend or sellers in a downtrend may be running out of strength. These signals can act as early warnings that a reversal or correction is near.
The main advantage is clarity. With colour-coded values or plotted markers, the indicator reduces guesswork and helps traders prepare for potential shifts in market direction. It also improves timing, allowing traders to avoid chasing late entries and instead focus on higher-probability setups.
Chart Example:

However, no tool is perfect. The Trend Exhaustion Indicator is not a crystal ball, and false signals can occur. Sudden news events, supply-demand imbalances, or fundamental shifts can override technical conditions. That’s why it works best when combined with price action, RSI, support and resistance, and volume analysis. Used this way, it becomes a powerful tool for spotting exhaustion and managing risk effectively.
Trading Strategies Using the Trend Exhaustion Indicator
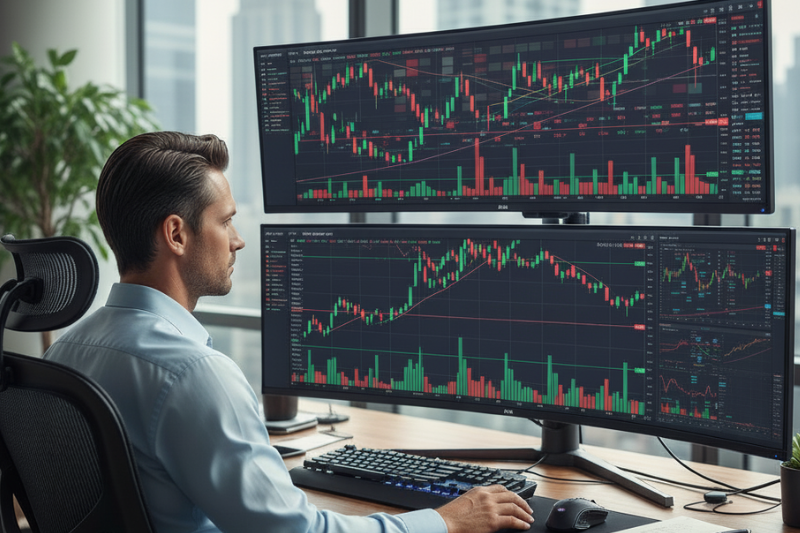
The true value of the Trend Exhaustion Indicator lies in how traders apply it. By structuring strategies around its signals, traders can turn early warnings of exhaustion into clear trading setups.
Reversal Setups
When exhaustion appears at a key support or resistance, it often signals a reversal. In an uptrend, exhaustion with a rejection wick at resistance suggests fading demand and a potential short. The opposite applies in a downtrend, where exhaustion at support plus bullish candlesticks can trigger longs.
Continuation Setups
Not every exhaustion reading ends in reversal. Sometimes it marks a short pause before the trend resumes, trapping early contrarians. For example, exhaustion in a downtrend may lead to a small bounce, then sellers take back control. Using RSI, divergence, and volume can help filter out these false signals.
Confirmation Methods
The best trades occur when exhaustion aligns with other tools. If exhaustion forms at resistance, RSI shows divergence, and a bearish engulfing candle appears, the probability rises. Multi-timeframe analysis adds precision, e.g., spotting exhaustion on the daily and refining entry on the 4H chart.
Best Timeframes
Although usable on any chart, short timeframes like 1min or 5min create too much noise. Swing traders usually rely on the 4H and daily, where signals reflect broader market behavior. This improves clarity and avoids chasing false short-term moves.
Risk Management
Risk control is essential. Stop losses should be placed beyond exhaustion points above recent highs in uptrends or below lows in downtrends. Keep risk per trade at 0.25%–0.5% of equity, aim for a take profit of at least 1:2 RR, and use scaling out when RSI or volume confirms continuation.
By combining these methods, the Trend Exhaustion Indicator becomes a reliable guide for trading both reversals and corrections while keeping risk under control.
Common Mistakes and How to Avoid Them

Even with a reliable tool like the trend exhaustion indicator, traders often fall into traps. Misusing signals, ignoring the bigger picture, or applying poor risk management can turn promising setups into costly errors. The table below highlights the most frequent mistakes and the practical steps to avoid them.
| Mistake | Why It’s a Problem | How to Avoid It |
| Over-reliance on the indicator | Treating the trend exhaustion indicator as a stand-alone system creates false confidence. Markets react to news, sentiment, and liquidity that no tool can fully predict. | Always combine the indicator with price action, fundamentals, and other indicators for confirmation. |
| Ignoring fundamentals | Exhaustion signals can fail if strong economic data, central bank actions, or sudden demand continue to push the current trend. | Check the news calendar, track macro drivers, and align signals with broader market context. |
| Poor risk management | Oversizing trades, skipping stop losses, or ignoring volatility can erase profits even from valid setups. | Keep risk small (0.25%–0.5% per trade), always use stop losses beyond exhaustion points, and adapt to market volatility. |
Practical Tips for Smarter Decisions
To make the most of the indicator, traders should combine it with a structured approach:
- Always view signals in relation to the overall market structure.
- Use the indicator to plan, not to predict. Preparation is the edge, not certainty.
- Practice reading exhaustion alongside candlestick behaviour to build confidence.
- Keep a journal of trades to see how exhaustion signals play out across different assets and time frames.
The more a trader learns to connect the indicator with real price action and risk management, the stronger their results become.
Conclusion
Spotting trend exhaustion helps traders anticipate when strong price movements are about to slow. On the chart, this often shows through candlestick patterns, volume shifts, or momentum indication. Whether it signals a trend reversal or just a correction, following clear rules ensures better timing and safer entries.
The right combination of the Trend Exhaustion Indicator, RSI, and support zones highlights when an upward move is weakening or when the beginning of a reversal is near. By reading these clues, traders gain confidence in applying consistent rules and navigating the market with clarity and discipline.
Don’t just study trend exhaustion! Trade It. Apply your skills in live markets with a Top One Trader funded account, and scale up to $500,000 in trading capital. Join now and turn strategy into success.
False Breakout Trading: Spot, Avoid, and Profit from It
Checked by the Top One Trader editorial team, experienced traders and analysts are committed to providing reliable, practical insights for funded trading success.
Every trader has experienced it: price breaks support or resistance, he opens a position expecting the price to continue in his favor. The move fails, the price reverses back, and he gets stopped out. This is a false breakout, one of the most common and costly patterns in trading, and avoiding them can save traders from repeated losses.
In this guide, you will learn the difference between false breakouts and real breakouts, how to identify them, how to manage risk when they occur, and how to use false breakouts in your favor to turn them into profitable trades.
Key Takeaway
- False breakout trading happens when the price briefly breaks support or resistance but fails to hold, trapping traders on the wrong side.
- By combining price action, technical analysis, and risk management, traders can learn to avoid costly mistakes and even profit from these failed moves.
- Understanding how bull traps and bear traps form is key to turning false breakouts into opportunities instead of losses.
What is a False Breakout?
A false breakout occurs when the price breaks above resistance or below support but fails to follow through, quickly returning inside the range. Instead of confirming a new trend, the move reverses, leaving breakout traders trapped in losing positions.
For example, price may break above resistance and attract new buyers, only to slide back under the level within a few candles. Or it may dip below support, trigger short entries, and then rebound higher. These failed moves are clear signals that the breakout attempt has collapsed.
False Breakout Examples
At Support Level (EUR/CAD)
Price breaks below support but quickly reverses back above it. This breakout fails, trapping sellers and shifting price direction upward.
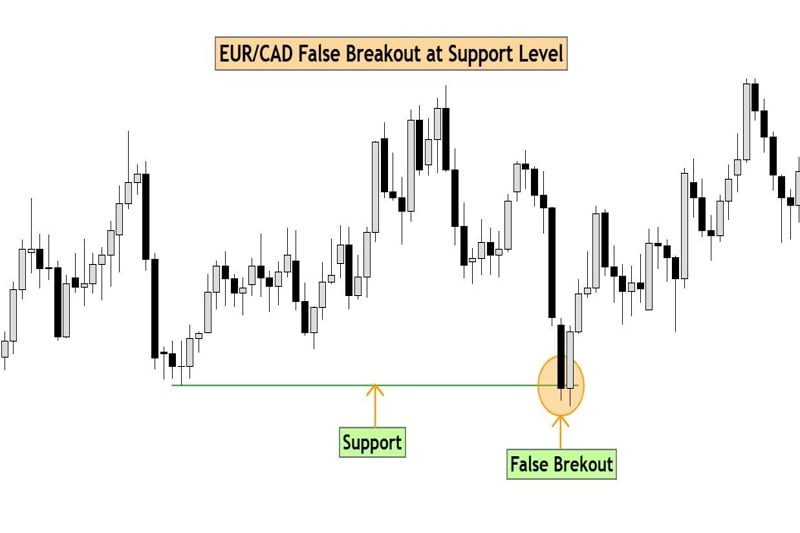
At Resistance Level (GBP/AUD)
Price pushes above resistance, then closes back under the level. When a breakout fails here, buyers are trapped, and price direction turns lower.
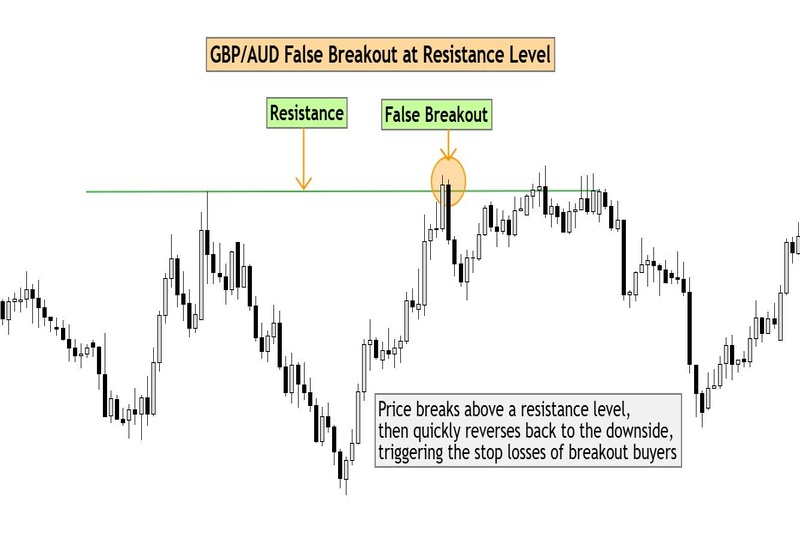
At a Trendline
Price breaks through a trendline but does not hold. The breakout fails, and traders who entered are trapped as the price direction reverses.
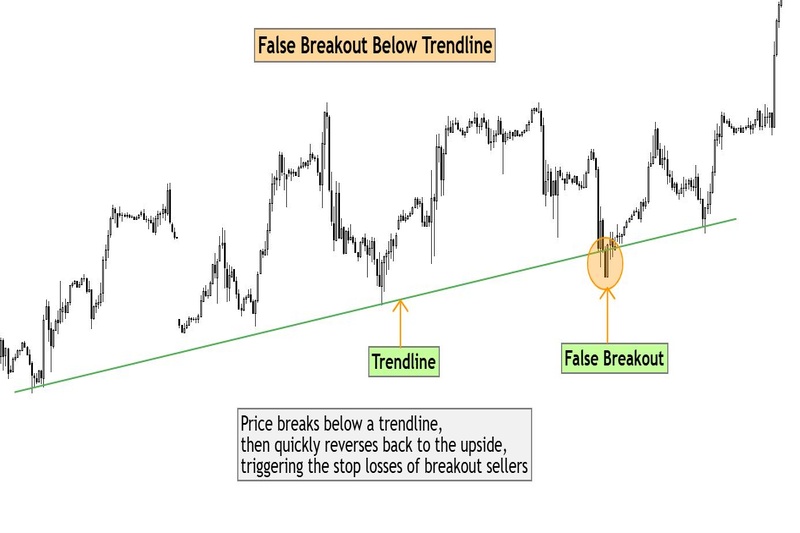
Key Differences Between True Breakouts and False Breakouts
| True Breakouts | False Breakouts |
| Price closes beyond support or resistance levels and continues in the breakout direction | Price briefly breaks levels but quickly reverses |
| Supported by rising volume and strong momentum | Lacks volume confirmation, momentum fades quickly |
| Followed by multiple candles in one direction | Usually just 1–2 candles before a reversal |
| Aligns with market structure and dominant trend | Often happens in range-bound markets or counter-trend moves |
In short: true breakouts show commitment, while false breaks reveal hesitation or manipulation.
Why False Breakouts Happen
There are a few common causes:
- Liquidity grabs
Markets need liquidity to move. Larger players will sometimes push prices past a key level to trigger stop losses or attract breakout traders, only to reverse direction once liquidity is collected. - News events
Sudden price spikes during major news announcements often cause fakeouts. The initial surge is emotional and not backed by sustained volume, leading to quick reversals. - Stop hunting
Institutions know where many traders place stops just above resistance or below support. Triggering those stops creates the perfect setup for a false move. - Timeframe conflict
Sometimes what looks like a breakout on a lower timeframe is just a correction against the dominant trend on a higher timeframe. Prices tend to respect higher timeframes more because they reflect a stronger market structure and attract greater trading volume.
This is why many traders say: “The market often breaks levels to trap, not to trend.”
How to Identify a False Breakout
In breakout trading, one of the biggest challenges is knowing whether the price move is genuine or just a trap. False breakouts happen often, and recognising them early can save you from costly mistakes. With a mix of price action, technical analysis, and awareness of market conditions, traders can filter out many fake signals before they commit.
False breakouts don’t appear only at support and resistance. They can occur along trend lines, channel edges, or even chart patterns such as triangles and head-and-shoulders. This is why context matters; price movements that look strong in isolation often lose credibility when checked against broader trending markets.
Price Action Signs
Charts reveal early warnings that a breakout might fail:
- Long wicks: If price breaks out but quickly rejects and closes back inside, the move is weak.
- Failed closes: Real trade breakouts usually hold beyond the level. Repeated failures to close are red flags.
- Engulfing or pin bars: These reversal candles show rejection of the level and hint at a failed attempt.
When you see these signals, the best course of action is to avoid entering. Patience often saves you from chasing unreliable price moves.
Multiple Timeframe Confirmation
Looking at only one chart can be misleading. A 15-minute chart might show a breakout, but zooming out to the 4-hour chart could reveal it as nothing more than a wick against the larger trend. Aligning short-term entries with higher timeframe market conditions ensures your breakout trading decisions fit the dominant structure.
Indicators and Tools
Technical analysis tools can provide extra confirmation:
- RSI divergence: If price breaks out but the RSI shows divergence (moving the opposite way), it signals a lack of strength. This often means the breakout will fail.
- MACD histogram: When the histogram shrinks during a breakout attempt, momentum is fading. Without strong momentum, the price move is unlikely to hold.
- Bollinger Bands: A reliable breakout usually pushes the bands wider. If they remain flat or contract, the breakout often collapses.
- ATR (Average True Range): Breakouts coming from low volatility (small ATR values) rarely last. The market needs energy behind the move to sustain it.
- ADX (Average Directional Index): Readings below 20 suggest weak trending markets. If there’s no trend strength, breakouts have a higher chance of failing.
Volume adds another layer. Breakouts without strong volume support rarely hold in real market conditions.
The more you learn and practice, the better you trade. That’s why Top One Trader combines expert education, a supportive trading community, and flexible funded accounts designed to help you reach your goals.
Join today and take the next step in building a stronger trading journey
How to Protect Yourself from a False Breakout
No trader avoids false breakouts forever. The key is limiting risk when price movements turn against you.
Use Stop Losses
Always place a stop loss just beyond the breakout point. If the price drops back inside the level, you exit before the losses grow. This approach keeps your trading capital safe when market conditions shift suddenly.
Strict Risk Management
Risk management is essential. Keep risk small, ideally no more than 0.5% to 1% of your account per trade. Breakout trading relies on probabilities, and protecting your account lets you survive the inevitable losing trades.
Confirmation Before Entry
If you haven’t entered yet, wait for proof. A strong candle supported by volume, or a retest that holds, is far more reliable than the initial push. By requiring confirmation, you filter out many weak breakout trades.
Avoid News-Driven Volatility
Breakouts that occur during major announcements are often unreliable. Sudden spikes may look like real price moves but quickly reverse. Professional traders often skip breakout trading during high-impact news and return once market conditions stabilize.
How to Take Advantage of a False Breakout
False breakouts often frustrate traders, but they can also provide some of the best opportunities in breakout trading. When price appears to break a key level but fails to hold, it leaves many traders trapped in losing positions.
Those trapped orders create momentum in the opposite direction, giving prepared traders a chance to profit. To understand how this works in practice, it’s important to look at the two most common types of failed breakouts: bull traps and bear traps.
Bull Traps and Bear Traps Explained
- Bull Trap: Price breaks above a resistance level, pulling traders into long positions, but then quickly reverses and closes back below resistance. This reversal often sparks strong downside momentum as buyers rush to exit.
- Bear Trap: Price dips below a support level, attracting short sellers, but then rebounds sharply and closes back above support. This sudden shift forces sellers to cover, driving prices upward.
These traps are reliable signals of a failed breakout and can be traded in the opposite direction once confirmed.
Trading the Reversal
The key to trading bull and bear traps is to enter as soon as the market shows clear rejection.
- Entry: Wait for a strong rejection candle at support in a bear trap or at resistance in a bull trap. Enter in the opposite direction once that candle closes.
- Stop Loss: Place your stop just beyond the false breakout point above the previous high in a bull trap or below the previous low in a bear trap. This protects you if the move continues.
- Target: Aim for the next key support or resistance level. A 1:2 or 1:3 risk-to-reward ratio is ideal, depending on market structure.
Practical Examples
- Bear Trap Example:
In this chart, the price breaks below support and appears ready to continue lower. But the move quickly fails, and a bullish candle forms. A long entry above this candle with a stop just under the low sets up a trade targeting the next resistance, delivering a clean 1:3 risk-to-reward.
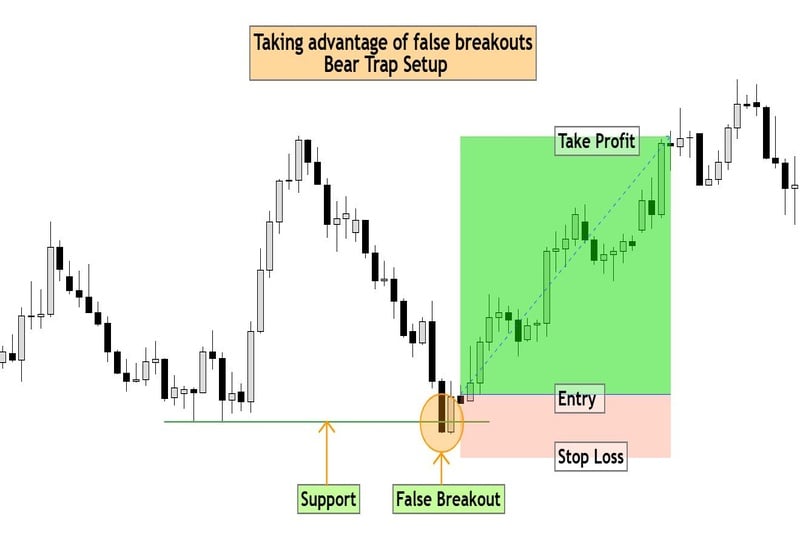
- Bull Trap Example:
In this chart, price pushes above resistance and tempts breakout buyers, only to reverse and close back under the level. A bearish rejection candle confirms the trap. A short entry below the rejection candle with a stop above the high, targeting the next support, offers a strong 1:3 risk-to-reward ratio.
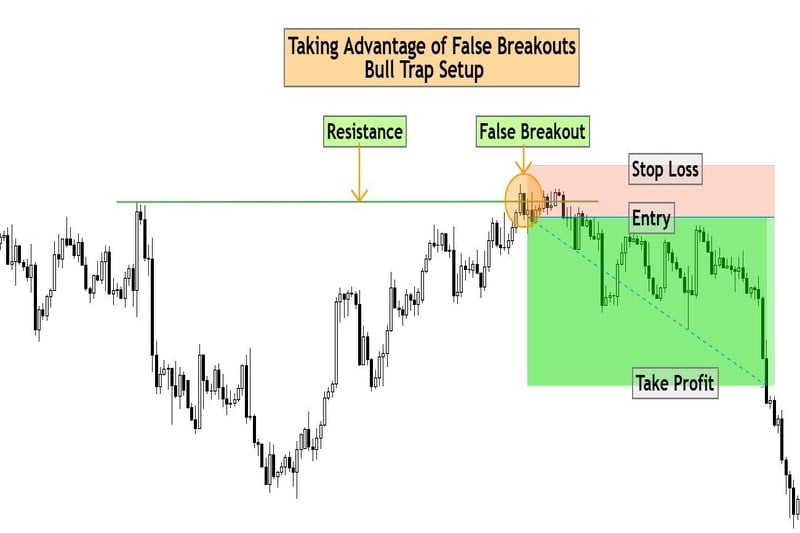
Additional Confirmations
While price action provides the clearest signal of a bull or bear trap, extra confirmation helps validate both the false breakout and the direction of the move that follows:
- RSI divergence: If price breaks out but RSI moves in the opposite direction, momentum is weak and the breakout is likely false. This often confirms a bull trap when price rejects resistance, or a bear trap when price rejects support.
- Volume analysis: A reversal from support or resistance with strong volume can confirm the presence of a bull or bear trap.
- Multiple timeframe analysis: Higher timeframes confirm the dominant trend, while lower timeframe candlestick patterns provide precise entry confirmation. If the breakout fails against the higher-timeframe trend, it often signals the start of a bull or bear trap.
Final Thoughts
False breakouts are frustrating, but they don’t have to be costly. By recognising common causes such as liquidity grabs, news events, and timeframe conflicts, traders can avoid being trapped on the wrong side of the market. You can turn false breakouts into a profitable trading strategy by trading the opposite side using bull and bear traps.
Using price action, technical analysis, and confirmations like RSI, volume, and multi-timeframe analysis helps filter weak setups and validate traps. Combined with disciplined risk management, this approach allows traders to protect capital while turning false breakouts into high probability setups.
Join Top One Trader and apply your trading strategy on a funded account. Top One Trader gives you the platform, funding, and fast payouts you need to grow, backed by reliable rules and industry-leading support. Focus on your strategy, we’ll handle the rest.
How to Pass Prop Firm Challenge: Essential Tips for Success
Checked by the Top One Trader editorial team, experienced traders and analysts are committed to providing reliable, practical insights for funded trading success.
Ever wondered how traders get funded by prop firms without risking their own capital? The answer is the prop firm challenge, a structured evaluation where traders must prove they can achieve profit targets while respecting strict drawdown and risk rules.
Passing unlocks access to large trading capital, generous profit splits, and scaling opportunities that personal accounts rarely provide. At the same time, these challenges are intentionally tough, designed to filter out impulsive or inconsistent traders.
In this guide, you will learn how to pass a prop firm challenge through strategy, risk management, psychological discipline, and long-term consistency.
Key Takeaway
- Build a winning strategy with clear rules, align it with the firm’s conditions, and respect profit targets, drawdown limits, and trading restrictions while applying strict risk management to protect capital.
- Stay disciplined and maintain emotional control, proving that you can manage capital responsibly and achieve long-term trading success, not just by passing the challenge.
Prop Firm Challenges Explained: Rules, Requirements, and How They Work
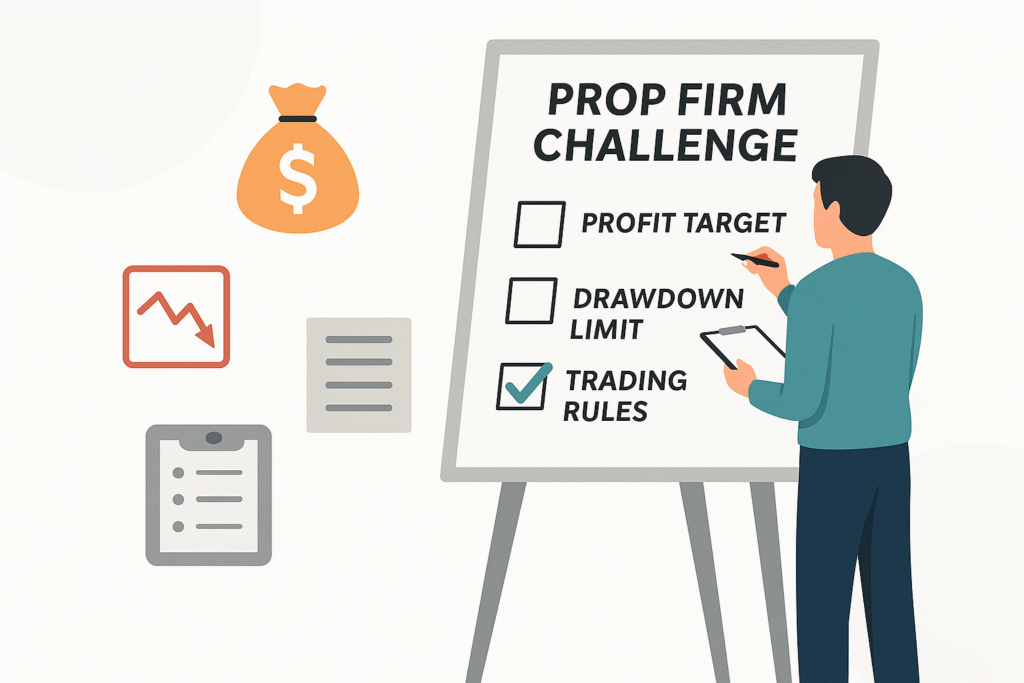
What Is a Prop Firm Challenge?
A prop firm challenge is an evaluation stage where traders use a demo account with virtual funds to prove they can trade profitably while respecting strict risk management rules.
The goal is simple: reach a predefined profit target while staying within drawdown limits and following the rules set by the firm.
Challenges may vary between firms, as each prop firm has its own rules regarding the number of steps to pass a challenge, drawdown limits, account sizes, and other trading restrictions.
Passing the challenge unlocks access to a funded account, profit splits, and scaling opportunities. However, failing to follow the rules results in losing the evaluation fee and having to start over.
Understanding the Firm’s Rules and Requirements
Every prop firm has unique requirements, and knowing them upfront is critical to success.
Typical rules include:
• Profit targets of 5–10%
• Daily drawdown limits of around 4–5%
• Overall drawdown limits of 8–10%
• Passing structure, which may involve 1-step, 2-step, or 3-step challenges depending on the firm and the type of challenge chosen
Beyond the numbers, some firms may also restrict certain trading styles. For example, some ban high-frequency trading (HFT), trading during high-impact news, or holding positions overnight or over weekends. Others may prohibit overleveraging or limit which instruments can be traded.
This is why reading the firm’s terms carefully is essential. Many traders fail not because of a poor strategy, but because they overlooked a specific rule. Aligning your trading plan with the firm’s conditions greatly increases your chances of passing the challenge and becoming a funded trader.
Building a Winning Trading Strategy

One of the first steps to pass a prop firm challenge is developing a trading strategy that not only suits your personality but also aligns with the rules of prop trading firms. A strategy is more than just entries and exits; it’s how you read the financial markets, apply technical analysis, fundamental analysis, and manage trades from the beginning to the end.
Trading styles you can choose from
• Swing trading: captures bigger moves by holding positions for several days. It is less stressful but may not always offer enough opportunities within the challenge period.
• Scalping: looks for small, quick gains. This style offers many entries but carries higher financial risk and may breach trading restrictions like daily drawdowns. Some prop firms also restrict high-frequency approaches.
• Day trading: often the most balanced option, allowing multiple trades per week without holding overnight. It helps meet minimum trading days while controlling exposure with stop loss orders.
Popular trading strategies include
• Trend following: aligning trades with the prevailing market direction and holding winners until momentum slows.
• Supply and demand: identifying price zones where institutions may buy or sell, often leading to strong reversals.
• Breakout trading: entering trades when the price breaks through key support, resistance, or consolidation zones.
• Mean reversion: assuming prices return to average levels after extreme moves.
• Fundamental analysis: making decisions based on economic data, interest rates, or news events, often paired with technical analysis for timing.
Ready to put your trading strategy into action?
Join Top One Trader and apply your skills in a funded account with capital up to $500,000, fast payouts, and industry-leading support. Prove your consistency, trade with confidence, and grow within a supportive trading community.
The right approach depends on your skills, temperament, and the firm’s rules, but what prop firms value most is consistency across different market conditions. Backtesting is essential to confirm win rates, drawdowns, and that your system has a real edge.
Your strategy must also respect firm rules by avoiding weekend holds if they are banned, stepping aside during high-impact news, and managing risk carefully. Breaking the goal into smaller milestones is smarter, aiming for 0.5-1% per day instead of forcing the full 10% target at once. This steady approach builds confidence, protects capital, and keeps you on track to pass the challenge.
Risk Management: The Deciding Factor

If there is one principle that separates traders who pass prop firm challenges from those who fail, it is risk management. Prop trading firms design their rules to eliminate reckless traders. To succeed, you must treat risk management not as an afterthought but as the foundation of your trading plan.
Position Sizing and Stop Loss Orders
Before entering any trade, know exactly how much you are willing to lose. For a funded account, the ideal risk is usually 0.25% to 0.5% per trade. This keeps you conservative, able to survive losses, and still recover. Stop loss orders should be placed at logical technical levels, not randomly. The balance of proper sizing and precise stop placement is what protects you from significant losses and keeps you within firm rules.
Risk to Reward Ratio
A strong trade setup always has a clearly defined risk-to-reward ratio. Many funded traders aim for at least 1:2, meaning if you risk 50 dollars, you aim to make 100 dollars. With this approach, even a 40% win rate can keep you profitable. Success is not about winning every trade but about ensuring that your winners outweigh your losers.
Planning Your Risk
You should create clear rules for how much you risk per trade, per day, and per week. This structure ensures that even during a losing streak, you stay within the firm’s drawdown limits.
Remember that when you open a trade, you never know how much you will win, even with the best strategy. Losses are always possible. The only thing you can control is how much you are willing to lose. That control comes from adjusting position size and placing stop loss orders correctly.
Managing Drawdowns
Drawdowns are the hardest stage of every trader’s journey. Consecutive losses test both discipline and emotional control. The natural instinct is to increase the lot size to recover quickly, but this usually makes the situation worse. A proper risk management plan protects you during these periods. If you reduce size temporarily, stay disciplined, and avoid breaking rules, you give yourself the chance to recover slowly and steadily.
Survival Over Speed
Most traders who fail a prop firm challenge do so because they rush and treat the account like a lottery ticket. Passing requires patience. A steady half percent here and one percent there is enough to build towards the target without unnecessary stress.
The firm does not care how fast you reach the goal. What they want is to see that you can protect capital and respect rules. If you can survive the difficult periods without breaking limits, opportunities will always come.
Psychology and Discipline in Prop Trading

Even with a strong trading strategy and solid risk management rules, psychology can make or break your performance. A prop firm challenge is more than just an evaluation of trading skills on a demo account. It is a pressure test where prop trading firms measure not only your technical analysis and ability to read market trends, but also your emotional discipline under stress.
Psychological Challenges That Sabotage Traders
• Greed pushes traders to aim for bigger gains than necessary, which leads to oversized trades that can hit maximum loss levels.
Fix: Stick to your trading plan and take profits at predefined levels instead of chasing more.
• Revenge trading happens when traders try to recover significant losses by forcing entries, which usually makes drawdowns worse.
Fix: Step away after consecutive losses and review your trading journal before placing another trade.
• Overtrading occurs when traders take setups that do not fit their trading plan just to stay active, leading to unnecessary mistakes.
Fix: Limit the number of trades per day or week and focus on quality setups.
• Fear often makes traders exit winning trades too early, cutting potential profits short and limiting long-term growth.
Fix: Trust your stop loss orders and let trades reach the planned profit target before closing.
• Hesitation prevents traders from taking valid setups, especially after consecutive losses, which results in missed opportunities and broken consistency.
Fix: Backtest your strategy so you have confidence in its edge, and commit to following signals when they appear.
These traps can undo weeks of progress in a single trade. It is easy to say the market does not work or that it is not your fault, but the key to success is becoming accountable and taking responsibility for every decision you make.
Building Discipline and Good Habits
Discipline is the foundation of passing a prop firm challenge because it ensures you can follow your trading plan consistently, control risk, and avoid impulsive mistakes. Without discipline, even the best strategy will fail under pressure.
The most successful traders build routines that keep them focused across market conditions.
Journaling trades, including entry reasons, stop loss placement, and emotions, helps track decisions and identify patterns.
Reviewing the economic calendar and marking key levels prepares you for volatility and reduces impulsive trades.
Regular backtesting sharpens your system, while continuous learning keeps you adaptable as markets change.
Passing a prop firm challenge is not about winning every trade but about consistent execution, controlled risk, and steady progress. Firms value disciplined traders over those who chase quick profits. Completing a challenge is only the beginning. The real journey starts with a funded account, where larger allocations and profit splits depend on long-term consistency.
Mastering your mind is essential, as emotional control, patience, and accountability protect capital and support steady growth across market conditions. Traders can earn significant income from funded accounts if they stay disciplined and stick to their trading plan.
Conclusion
Passing a prop firm challenge is not about speed or luck; it is about proving that you can trade with discipline, consistency, and respect for risk. A strong trading strategy aligned with firm rules, backed by proper backtesting and risk management, gives you the foundation to succeed.
Just as important is mastering psychology, since emotional control determines whether you can stay consistent under pressure. Remember, the challenge is only the first step. Long-term success comes from treating trading like a profession, building habits that protect capital, and steadily compounding profits over time.
Ready to Prove Your Skills?
Join Top One Trader today and take on a prop firm challenge with capital allocations up to $500,000, fast payouts, and a supportive trading community. Start your journey to becoming a consistently funded trader now.
Forex Terminology: Key Terms Every Trader Should Know
Checked by the Top One Trader editorial team, experienced traders and analysts are committed to providing reliable, practical insights for funded trading success.
Ever wondered what traders really mean when they talk about pips, spreads, or leverage? Stepping into the forex market can feel overwhelming if you don’t speak the language. Every trade, chart, and strategy depends on a set of terms that explain how currency trading works.
In this guide, we’ll break down the most important forex terminology so you can trade with clarity and confidence. From currency pairs and trade sizes to leverage, orders, and risk management, you’ll gain the foundation needed to navigate the world’s largest financial market like a professional.
Quick Overview
- Understanding Forex Terminology helps traders interpret currency pairs, pips, spreads, and leverage, enabling clearer decisions and better risk management.
- Applying Key Terms in Practice improves trading strategy, supports disciplined market analysis, and enhances long-term success in forex trading.
Basics of the Forex Market

Ever wondered why the forex market is so different from stocks or commodities? The truth is that its size, liquidity, and participants make it unique, and these basics form the foundation every trader needs to understand. Let’s break it down step by step.
Forex Market
The forex market is the largest financial market in the world, with daily trading volumes above $7 trillion. It operates 24/5 across global hubs, giving forex traders unlimited opportunities. Unlike stocks, forex trading has no central exchange, making it a truly global and decentralised market.
Liquidity
Liquidity means how easily currencies can be bought or sold without sharp swings. At the end of the day, this deep liquidity makes forex attractive to traders.
Market Participants
From banks and hedge funds to corporations and retail forex traders, many players drive supply and demand. Central banks are especially powerful, influencing currency trading through interest rates and policy.
Monetary Policy
Think of monetary policy as the steering wheel of the foreign exchange market. Rate hikes usually strengthen a national currency, while cuts often weaken it. Financial decisions frequently reflect efforts to manage inflation, employment, and overall price stability in the economy.
Currency Pairs and Exchange Rates
At its core, forex is about exchanging one currency for another. A currency pair consists of a base and a quote. For example, in EUR/USD, the euro is the base and the U.S. dollar the quote. The exchange rate shows their relative value, such as EUR/USD = 1.10, meaning one euro equals 1.10 U.S. dollars.
Major pairs like EUR/USD, GBP/USD, and AUD/USD dominate daily trading volumes with high liquidity and tight spreads. If EUR/USD rises, the euro strengthens against the dollar; if it falls, the euro weakens. This quotation structure helps forex traders identify trends, set entry and exit points, and refine a trading strategy.
Price Influences
You might be surprised by how many factors affect exchange rates. Interest rates, GDP growth, unemployment rates, inflation, and geopolitical events all contribute to market volatility. Central banks and government policies also play a major role in shaping currency prices and overall price stability.
Trade Sizes, Units, and Orders

Let’s say you already understand how currency pairs work. The next step is learning trade sizes and how positions and orders work, because the size of your trade, the smallest price movement (pip), and the type of order you place all determine your profit or loss.
Believe it or not, many beginners overlook this, and it directly affects risk management.
1 – Lot Size and Position Sizing
Forex trades are measured in lots: a standard lot equals 100,000 units, a mini lot equals 10,000, and a micro lot equals 1,000. Smaller lots give beginners more control over risk.
Position sizing is just as important; adjusting trade size based on your account balance ensures you don’t risk too much on a single trade.
2 – Pips and Pip Value
A pip (percentage in point) is the smallest unit of movement in forex, usually the fourth decimal place. For example, if EUR/USD moves from 1.1050 to 1.1051, that’s a one-pip change. The value of a pip depends on lot size, with larger lots making each pip movement have a greater impact on profits or losses.
3 – Risk Management
At the end of the day, both lot size and pip value tie directly into risk management. Understanding how each price movement impacts your account is critical to surviving in the forex market.
4 – Trading Positions (Long and Short)
In forex trading, a long position means buying a currency pair, expecting the base currency to increase in value against the quote. Traders usually go long when they are bullish on the market.
By contrast, a short position means selling a currency pair, anticipating that the base currency will weaken. This allows traders to profit in falling markets.
5 – Market Order
A market order executes instantly at the current price. It’s the fastest way to enter or exit, though in volatile markets, slippage can occur.
6 – Limit Order
Suppose EUR/USD moves toward your chosen price level. A limit order ensures your trade is executed at that level, not just the current market price.
7 – Stop-Loss and Take-Profit Orders:
You might be surprised how many traders ignore these. Stop-loss and take-profit orders define your entry and exit, protecting your capital and automatically locking in profits.
Want to make position sizing easier? Instead of doing the math manually, use the Top One Trader Position Size Calculator to quickly find the right lot size and manage your risk with confidence.
Leverage, Margin, and Account Balance
Leverage and margin are two of the most powerful and riskiest tools in forex. In other words, they give traders access to much larger positions than their deposit allows, but without proper risk management, they can quickly wipe out an account.
Leverage
Think of leverage as a magnifying glass. It lets traders control large trades with a small deposit. For example, 100:1 leverage means $1,000 can control a $100,000 position. The reality is that this can multiply both profits and losses.
Margin and Margin Call
Margin is the deposit required by forex brokers to open a leveraged trade, acting as a security buffer to ensure you have funds in the game. A margin call happens when your account balance falls below the broker’s required margin level, which can lead to open positions being closed automatically unless more funds are added.
Equity
Equity reflects your account’s real-time value, including open positions. At the end of the day, monitoring equity closely helps prevent being caught off guard by sudden price movements.
Open Positions
You’ll notice that open positions are trades still active in the market. Keeping track of margin usage, required margin level, and equity across these positions is key to managing account balance safely.
PnL (Profit and Losses)
PnL represents the outcome of your trades. Realised PnL is the profit or loss from closed trades, while unrealised PnL reflects the changing value of open positions as prices move. Together, they show whether your account is gaining or losing money at any moment.
Forex Market Analysis

Let’s break it down: no trader can succeed without strong market analysis.
The fact is that trading decisions rely on studying historical price data, using technical analysis tools, and following fundamental analysis of economic events.
Technical Analysis: In practice, technical analysis uses charts and historical forex prices to forecast future moves. Traders rely on price action, such as candlestick patterns, as well as technical indicators like moving averages, RSI, and MACD to identify trends, refine strategies, and pinpoint entry and exit points.
Fundamental Analysis: Fundamental analysis focuses on the bigger picture. Interest rates, unemployment rates, political stability, and geopolitical events often create sharp volatility in forex markets.
Identify Trends: As you might guess, one of the main goals of analysis is to identify trends. Recognising whether the market is trending or ranging helps you apply the right trading strategy.
Price Level: On the other hand, every piece of analysis eventually comes back to the price level. Whether you’re using a chart pattern, resistance level, or reacting to news, forex prices guide entry and exit decisions.
Psychology and Risk Management

Many traders fail not because of bad technical analysis or poor understanding of forex prices, but because of emotions. The truth is that psychology and risk management often decide whether you succeed or struggle in trading.
At the end of the day, discipline is just as important as any strategy.
Risk/Reward Ratio
Here’s the catch: the risk/reward ratio compares potential profit with potential loss. By sticking to positive ratios, traders can survive long-term even with average win rates.
Stop-Loss Orders
You’ll notice that stop-loss orders are a trader’s safety net. They protect against unexpected moves and enforce discipline, taking emotions out of the decision.
Emotional Decision Making
The point is that fear and greed are the biggest enemies. Emotional decision-making often leads to errors, while staying calm and logical keeps your trading strategy intact.
Revenge Trading
At the end of the day, revenge trading is one of the costliest mistakes. Chasing losses by placing impulsive trades usually compounds errors and drains your account balance.
Fear and Greed
Fear often leads traders to close winning trades too early or avoid good setups, while greed pushes them to over-leverage, ignore stop-losses, or chase the market. Both emotions cause emotional decision-making instead of following a trading strategy. Managing fear and greed with discipline and risk management is essential for long-term success.
Additional Trading Terms to Know

For example, beyond the basics, forex has additional terms that shape costs, strategies, and real-world trading decisions. Picture this: knowing about CFDs, carry trades, and spreads can save you from costly surprises.
CFDs (Contracts for Difference): Let’s say you want to speculate on currency prices without owning the actual asset. CFDs allow exactly that, offering flexibility but also adding fees and leverage risks.
Swap and Rollover: You might be surprised by this: holding a trade overnight often triggers a swap or rollover. Depending on the interest rate differences, you’ll either pay a fee or receive a credit.
Spread: The spread is the difference between the bid (sell) price and the ask (buy) price. It represents the basic cost of entering a trade. Active forex traders prefer tighter spreads because they lower overall costs and make short-term strategies more efficient.
Trading Costs: Beyond the spread, traders also face other costs such as swaps, commissions, and slippage. These additional trading costs directly affect account balance and profitability. Factoring them into your risk management and trading strategy is essential to ensure that profits remain sustainable after expenses.
Conclusion

Learning forex terminology is the first step to trading with confidence. By understanding key concepts like currency pairs, lots, pips, leverage, and margin, you gain the tools to interpret price movements and manage risk effectively. Beyond definitions, strong market analysis and disciplined risk management ensure strategies remain sustainable.
Just as important is psychology. Patience and discipline often decide whether traders succeed or fail. Whether you’re starting out or sharpening your skills, applying this knowledge in practice will help you trade smarter, avoid costly mistakes, and build a solid foundation for long-term success in the forex market.
Ready to put your knowledge into action? Join Top One Trader today and get access to educational content, flexible funded accounts up to $500,000, advanced trading platforms, and a supportive trader community with 24/7 assistance. Start your journey with confidence.